


 128 / 152

Analysis of Agri-Food Trade Structures
To Promote Agri-Food Trade Networks
In the Islamic Countries
111
Table 27: Leading Export Product - Destination Combinations for Tunisia, 2016.
Product
Leading Export Destinations
Fish and crustaceans
Italy, Spain, France, Malta, Japan, Jordan, Algeria, France, Russia, Turkey.
Pasta
Libya, Ethiopia, Niger, Equatorial Guinea, France, Saudi Arabia, Morocco, Cameroon,
Chad, New Zealand.
Bread products
Libya, France, Algeria, Italy, Morocco, Gabon, Jordan, Lebanon, Cote d’Ivoire, Congo.
Vegetables (fresh)
France, Libya, Italy, Netherlands, UAE, Russia, Saudi Arabia, Germany, Spain,
Burkina Faso.
Vegetables (prepared)
Libya, Italy, France, Algeria, Netherlands, Germany, Canada, Belgium, Lebanon, USA.
Fruit and nuts
Morocco, France, Germany, Italy, USA, Spain, Libya, Malaysia, Indonesia, UAE.
Margarine and
shortening
Libya, Cameroon, Gabon, Congo, Guinea, Gambia, Mauritania, Lebanon, Madagascar,
Jordan.
Other edible products
Senegal, Libya, Algeria, USA, Germany, Cuba, France, Ethiopia, Saudi Arabia, Guinea.
Tobacco
France, Libya, Turkey, Belgium, Morocco, Algeria, USA, Germany, Denmark.
Olive oil
Italy, Spain, USA, France, Canada, Saudi Arabia, Seychelles, Portugal, UAE, Morocco.
Source: UN Comtrade.
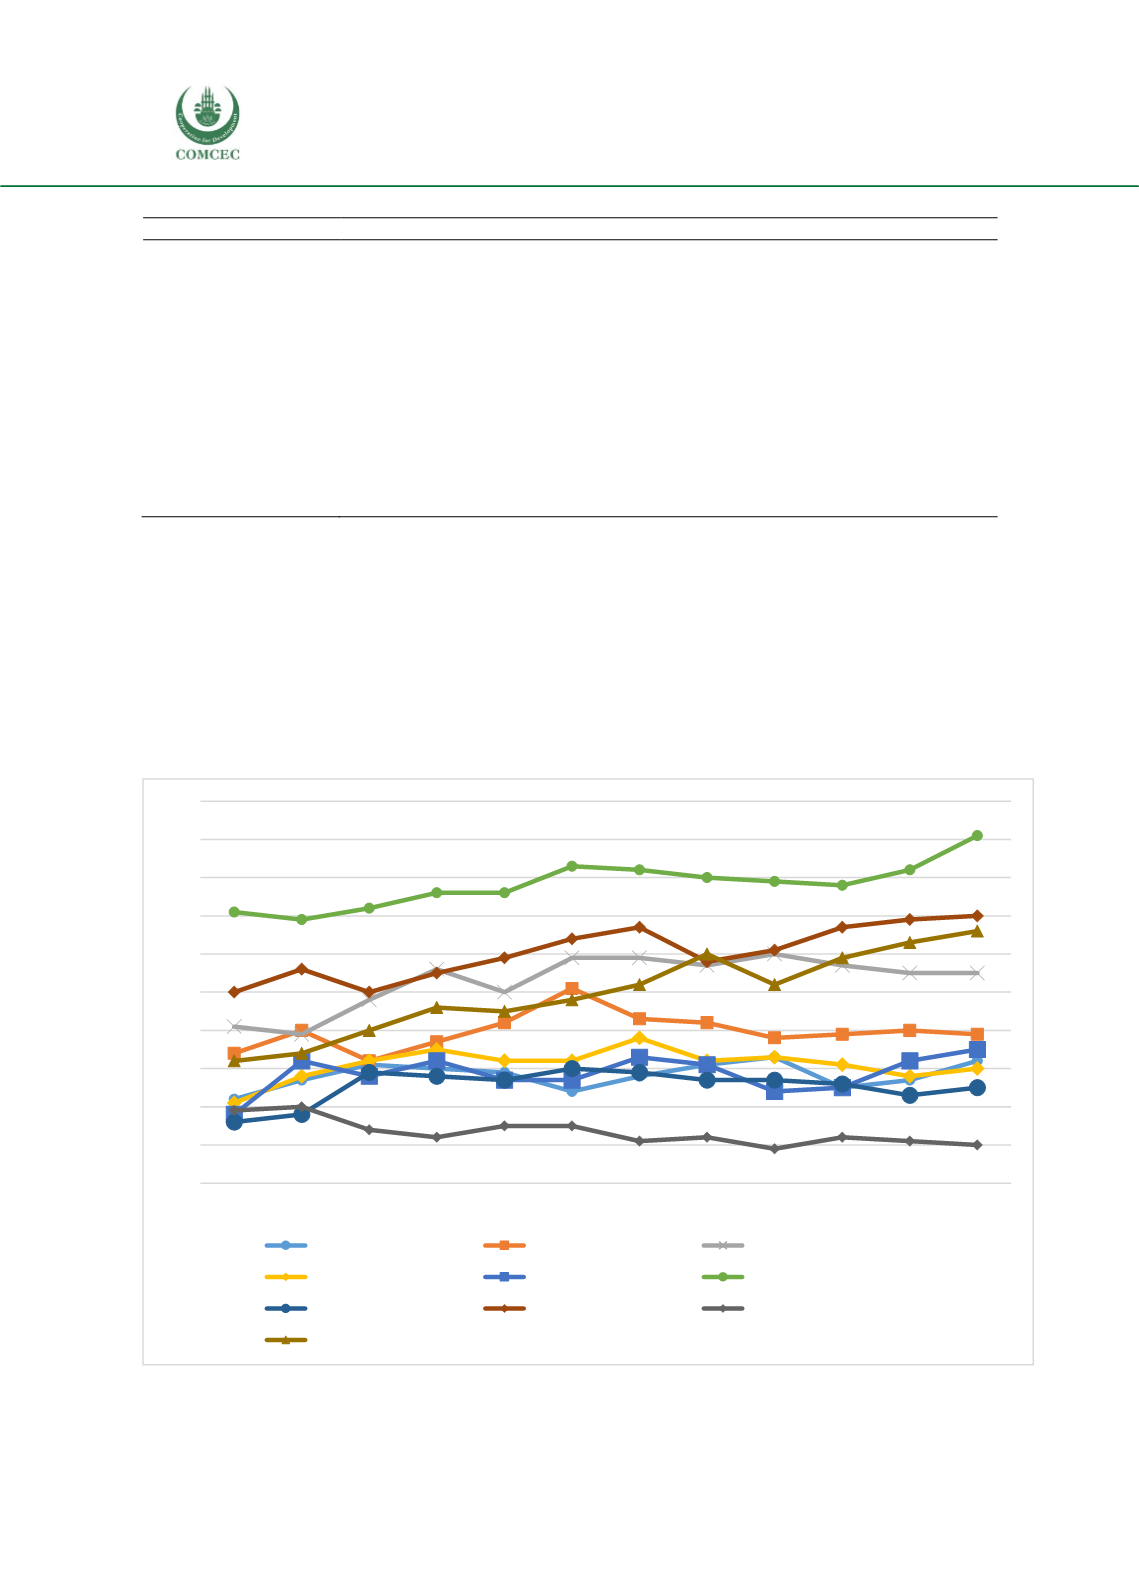
The above insights can be formalized by analyzing degree centrality, i.e. the number of countries
it has direct trade links with. Figure 56 shows results for the export side. There is a clear
tendency towards increasing geographical diversification of exports over the last decade, the
only exception being tobacco, where foreign markets in 2016 were fewer in number than in
2005. This result suggests that although Tunisia’s exports are relatively concentrated in the
product dimension, that concentration is to some degree offset over time by increasing diversity
in markets served.
Figure 56:
Out Degree Centrality, Ten Leading Tunisian Agricultural Exports, 2005-2016, Number
Source: UN Comtrade.
0
10
20
30
40
50
60
70
80
90
100
2005 2006 2007 2008 2009 2010 2011 2012 2013 2014 2015 2016
Fish and crustaceans
Pasta
Bread products
Vegetables (fresh)
Vegetables (prepared)
Fruit and nuts
Margarine and shortening
Other edible products
Tobacco
Olive oil