


 130 / 152

Analysis of Agri-Food Trade Structures
To Promote Agri-Food Trade Networks
In the Islamic Countries
113
authorities have tried to limit imports of agri-food products despite the effect of the
deterioration of the Tunisian dinar exchange rate.
Figure 58: Trends in Agri-Food Imports of Tunisia, 2005-2016, Million USD
Source: UN Comtrade retrieved through WITS.
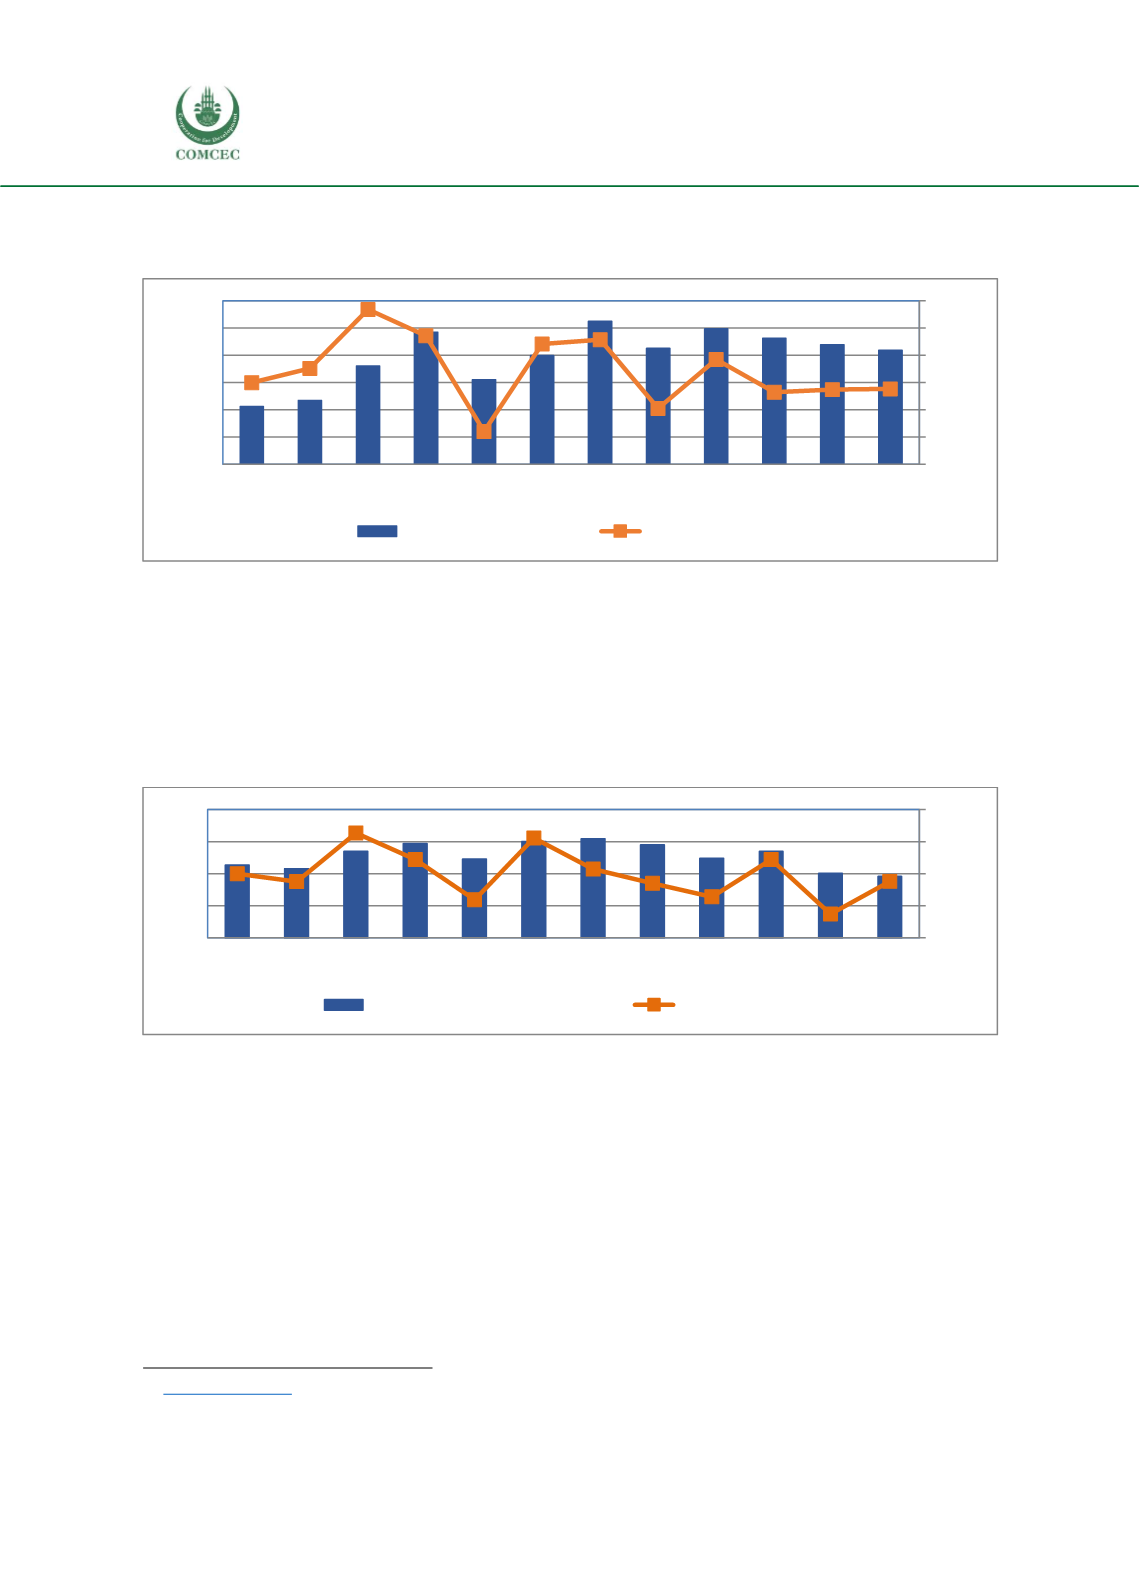
Imports of agricultural raw materials during the period 2005-2016 have some fluctuations.
Following a slight increase during the period 2005-2011, it decreased significantly from 308.6
million USD in 2011 to 191.7 million USD in 2016
(Figure 59). The annual growth rate of these
imports varies between -30% and 20%. Since 2014 this rate has remained fairly close to zero.
This last observation confirms the efforts made by the Tunisian authorities to limit the
deterioration of trade balance, which is in deficit.
Figure 59: Trends in Agricultural Raw Materials Imports of Tunisia, 2005-2016, Million USD
Source: UN Comtrade retrieved through WITS.
As mentioned above, imports of fishery products do not exceed 5% of total imports of
agricultural products. The annual growth rate of imports is quite variable during the period
between 2005 and 2016. In fact, the fisheries and aquaculture sector in Tunisia contributed to
6.4% of the value of agricultural production during the period 2006-2016, 12.9% to the value of
agricultural exports and generated 51261 direct jobs. The average per capita annual
consumption of seafood and aquaculture is around 12 kg per year. There are 41 fishing harbors
with a capacity of 150 000 tons per year and 2 fishing ports under construction and 13 908
fishing units including 12 775 active units.
108
10
8 www.onagri.nat.tn .-60%
-40%
-20%
0%
20%
40%
60%
0
500
1.000
1.500
2.000
2.500
3.000
2005 2006 2007 2008 2009 2010 2011 2012 2013 2014 2015 2016
Agri-Food Products
Growth Rate (%)
-40%
-20%
0%
20%
40%
0
100
200
300
400
2005 2006 2007 2008 2009 2010 2011 2012 2013 2014 2015 2016
Agricultural Raw Materials
Growth Rate (%)