


 125 / 152

Analysis of Agri-Food Trade Structures
To Promote Agri-Food Trade Networks
In the Islamic Countries
108
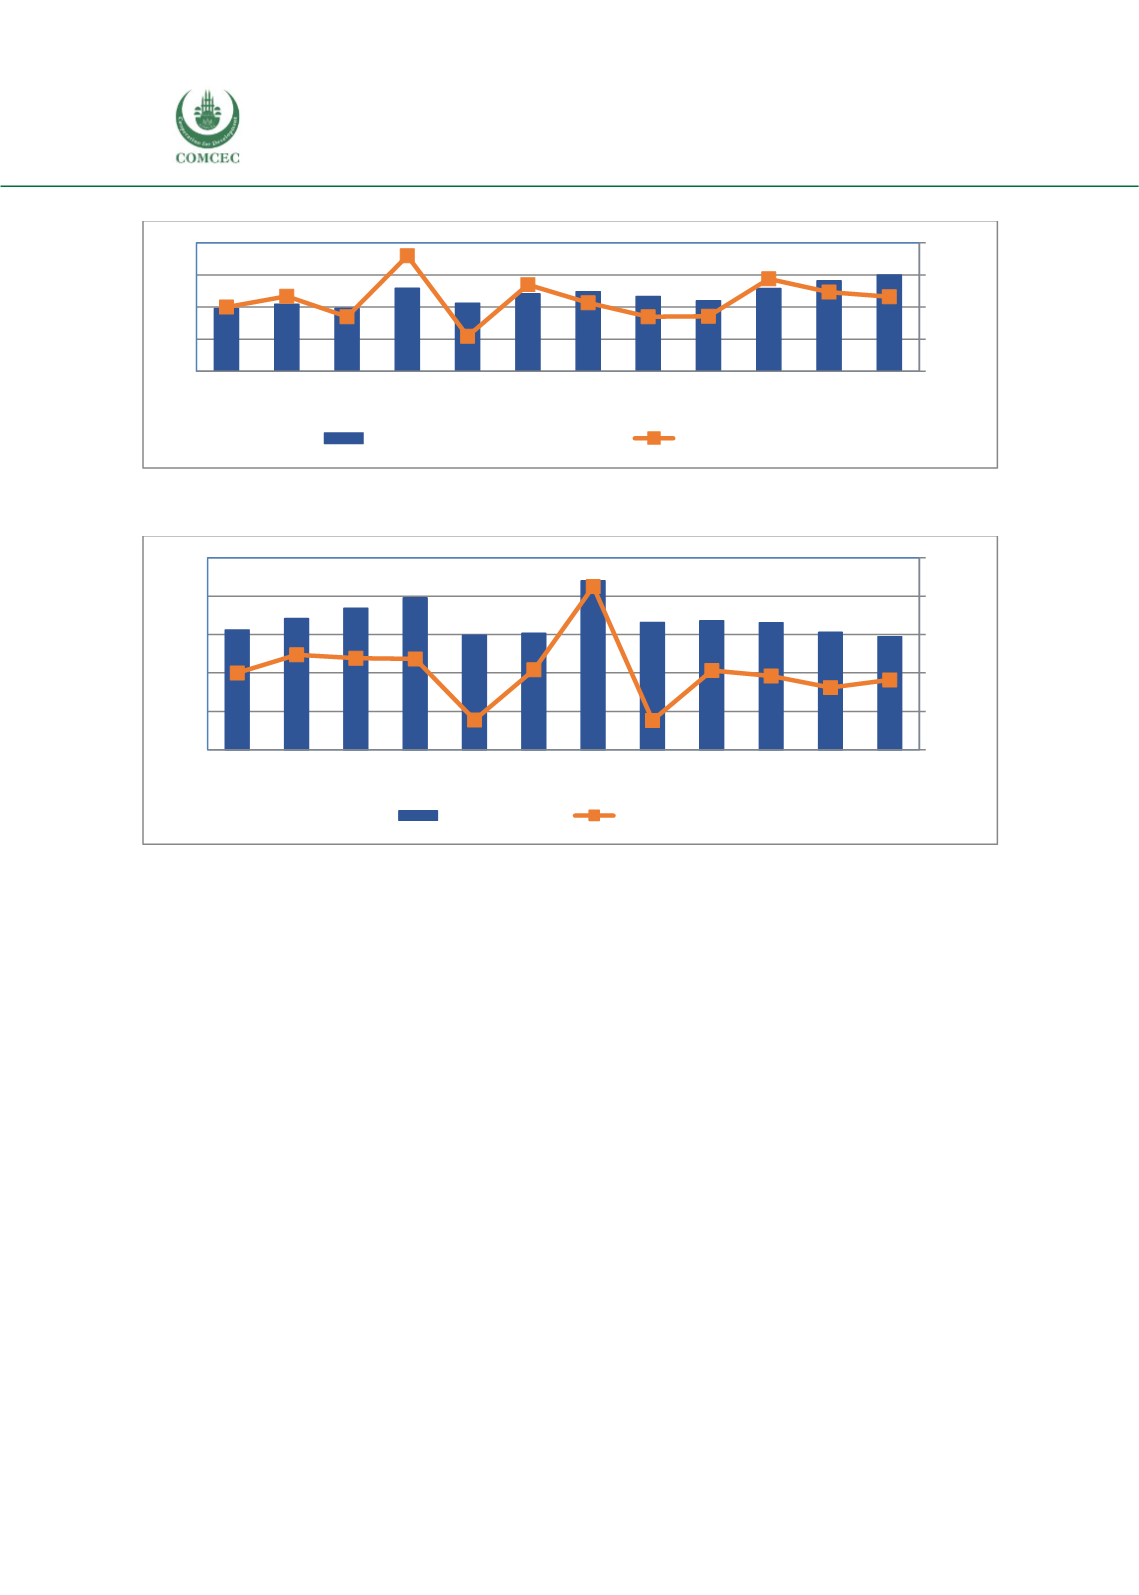
Figure 50: Trends in Agricultural Raw Materials Exports of Tunisia, 2005-2016, Million USD
Source: UN Comtrade.
Figure 51: Trend in Fish Products Exports of Tunisia, 2005-2006, Million USD
Source: UN Comtrade.
For fish products, during the period 2005-2016, exports did not vary significantly, with an
average of around 150 to 160 million USD. A peak was observed during 2011 with more than
220 million USD of exports whereas, since 2012, there has been a continuing downward trend
in exports of those products.
At a more disaggregated level according to the Annex 1 classification, Tunisia’s trade patterns
are relatively concentrated. Using average values for 2014 through 2016, the ten leading export
products in the agricultural sector accounted for 78% of the total. Those products were (in
order) olive oil, fruit and nuts, fish and crustaceans, tobacco, fresh vegetables, pasta, bread
products, margarine and shortening, other edible products, and prepared vegetables
. Figure 52shows the evolution of exports of these products over the last decade. Values exhibit steady
growth in most cases, except for olive oil, which fluctuates much more than the other products,
and fish and crustaceans, which are on a downwards trend.
-40%
-20%
0%
20%
40%
0
20
40
60
80
2005 2006 2007 2008 2009 2010 2011 2012 2013 2014 2015 2016
Agricultural Raw Materials
Growth Rate (%)
-40%
-20%
0%
20%
40%
60%
0
50
100
150
200
250
2005 2006 2007 2008 2009 2010 2011 2012 2013 2014 2015 2016
Fish Products
Growth Rate (%)