


 123 / 152

Analysis of Agri-Food Trade Structures
To Promote Agri-Food Trade Networks
In the Islamic Countries
106
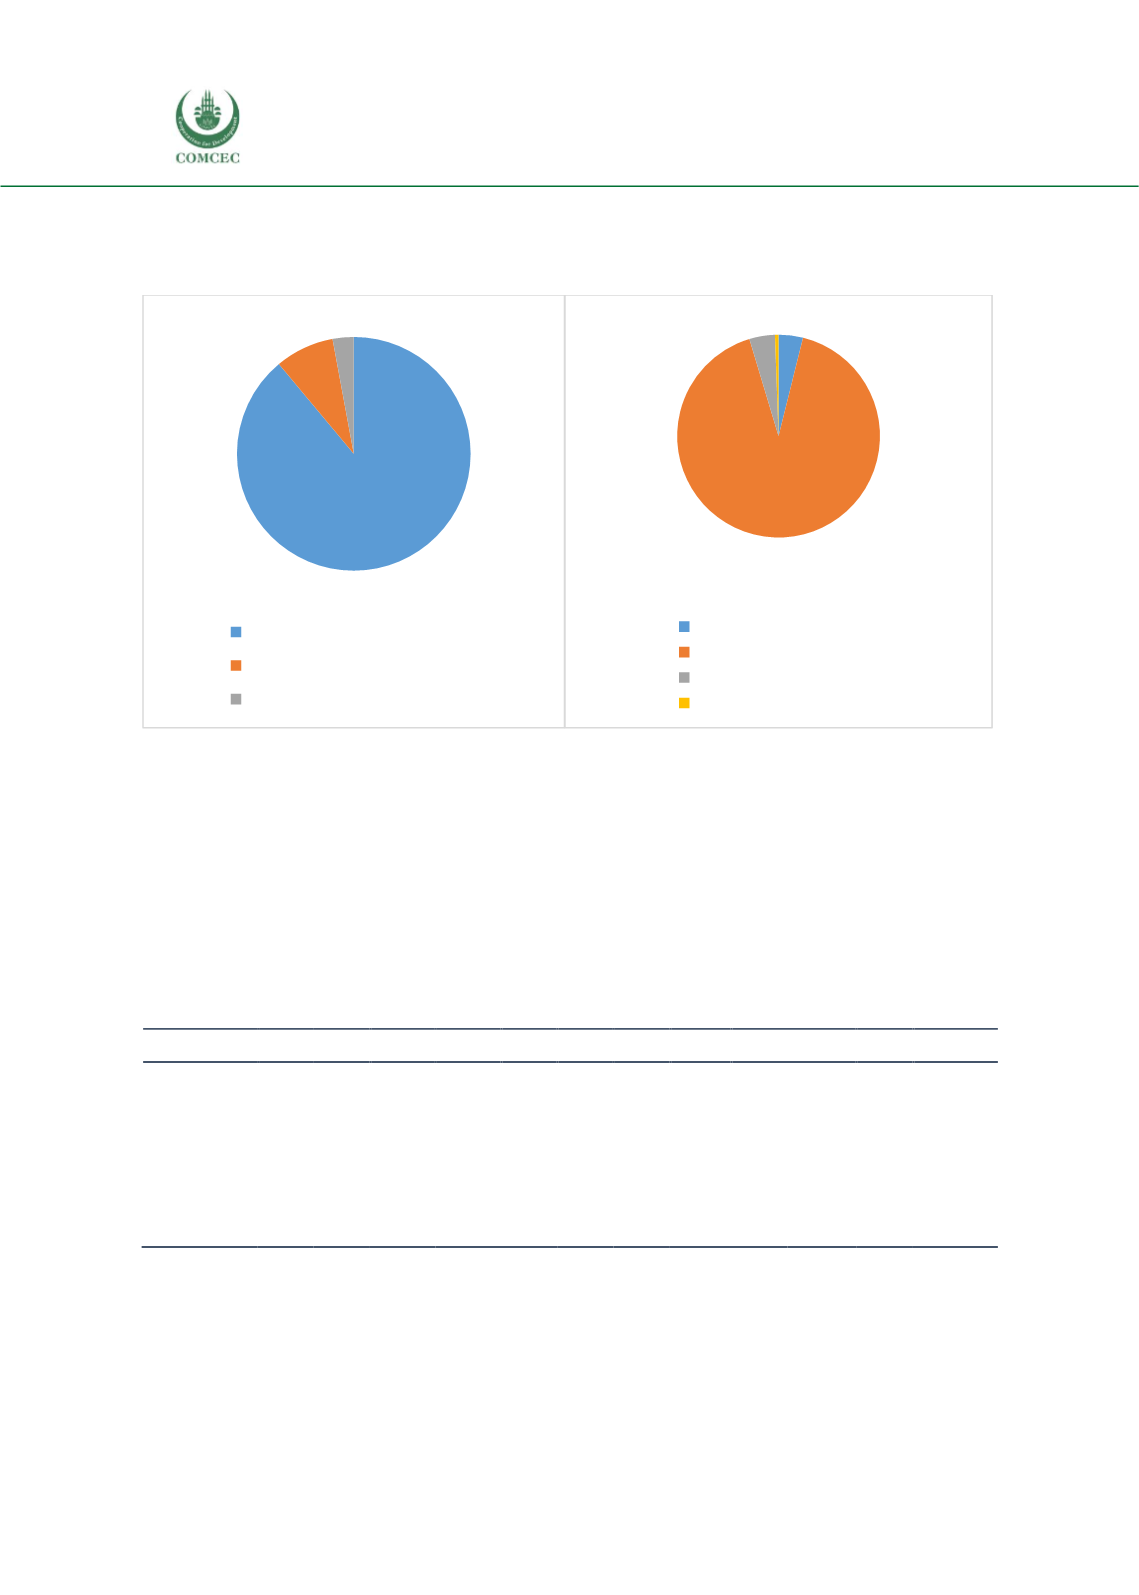
For imports, non-OIC countries accounted for 91.5%. Agri-food products accounted for 88.9%
of Tunisian imports of agricultural products.
Figure 47: Product Composition and Origin of Agricultural Imports, 2016, Percent
Source: UN Comtrade.
Composition and patterns of agricultural exports
Before turning to imports, the analysis first looks at the composition and patterns of exports –
for agricultural products only.
Table 26and
Figure 48 show that, between 2005 and 2016,
exports of agricultural products fluctuated with an upward trend. A record of 2043 million US
dollars was recorded during 2015. This confirms the existence of strong potentialities that the
agricultural sector in Tunisia could exploit. Moreover, the share of agri-food products exceeds
80%. This is the main sub-sector followed by fish products. On the other hand, the share of
agricultural raw materials is practically negligible (does not exceed 5%)
Table 26: Export Performance of Agricultural Products, 2005-2015
Products
2005
2006
2007
2008
2009
2010
2011
2012
2013
2014
2015
2016
Agricultural
Products
1,120 1,419 14,744 17,577 1,371 1,309 1,836 1,609 1,671
1,345 2,043
1,447
Agri-Food
Products
925 1,207
1,250
1,507 1,179 1,109 1,566 13,977 1,460
1,128 18,344
1,240
Agricultural
Raw
Materials
39
422
39
522
42
48
50
477
444
522
56
6,060
Fish Products
156
171
184
1,988
149 1,522
220
1,666
168
165
1,533
147
Source: UN Comtrade.
89%
8%
3%
Agri-Food Products
Agricultural Raw Materials
Fish Products
4%
91%
4%1%
Asian OIC countries
non-OIC countries
Arab OIC countries
African OIC countries