


 127 / 152

Analysis of Agri-Food Trade Structures
To Promote Agri-Food Trade Networks
In the Islamic Countries
110
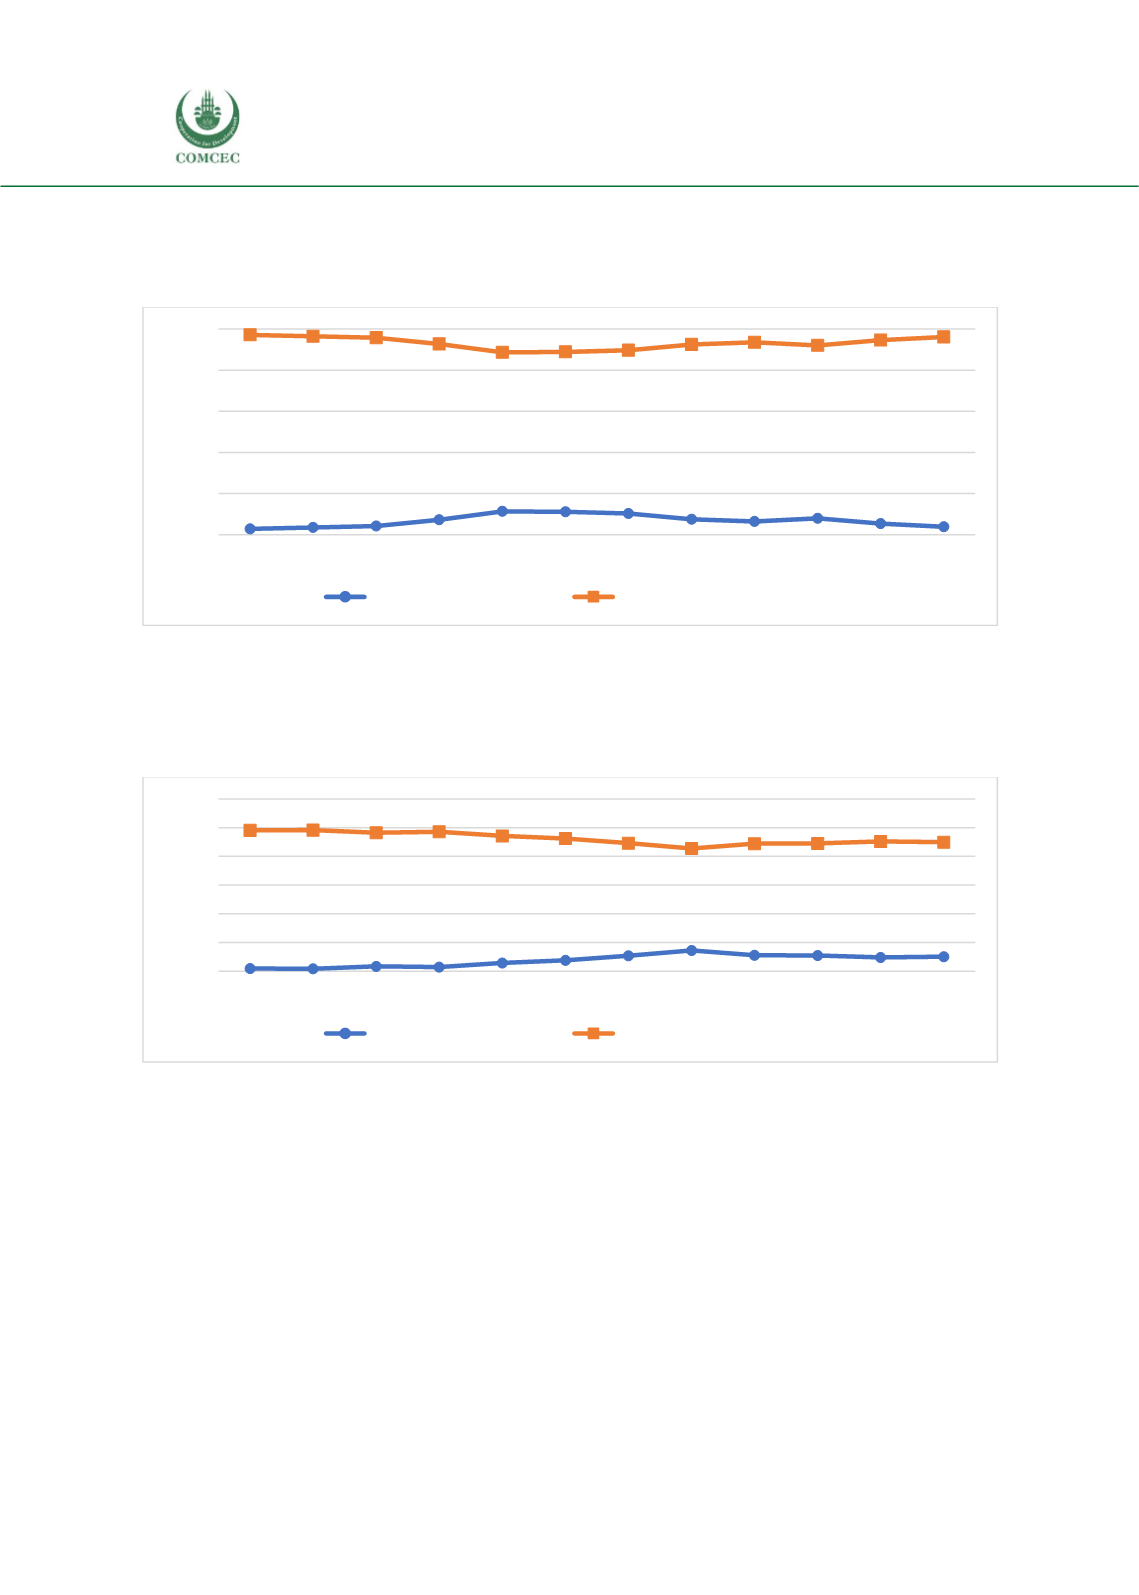
During the period 2005-2016, the share of agricultural raw materials exports to OIC member
countries was quite low, not exceeding 10% of total exports, with almost all exports of
agricultural raw materials destined to countries outside the region.
Figure 54:
Trends in Tunisian Agricultural RawMaterials Export Destinations, 2005-2016, Percent
Source: UN Comtrade.
During the period 2005-2016, the share of exports of fishery products to OIC member countries
remained relatively low compared to non-OIC countries. It went from 1.9% in 2005 to 14.5% in
2012. Then, it decreased slightly to reach 10.1% in 2016.
Figure 55: Trends in Tunisian Fish Products Export Destinations, 2005-2016, Percent
Source: UN Comtrade.
At the disaggregated product level, it is possible to examine Tunisia’s place in global and regional
trade networks by first looking at major bilateral linkages for the 10 leading products identified
above (Table 27). For all products, there is a clear regional dimension, with strong trade linkages
across the Mediterranean area. The EU stands out as a major partner in most sectors. But links
with African countries are also important for pasta, bread products, an dmargerine and
shortening, while links with the relatively distant US market stand out for fruit and nuts, other
edible products, and olive oil. Finally, there are some emerging linkages with Asian countries,
for instance with Japan for fish and crustaceans, and Malaysia for fruit and nuts and margarine
and shortening.
0%
20%
40%
60%
80%
100%
2005 2006 2007 2008 2009 2010 2011 2012 2013 2014 2015 2016
Exports OIC countries
Exports non-OIC countries
0%
20%
40%
60%
80%
100%
120%
2005 2006 2007 2008 2009 2010 2011 2012 2013 2014 2015 2016
Exports OIC countries
Exports non-OIC countries