


 126 / 152

Analysis of Agri-Food Trade Structures
To Promote Agri-Food Trade Networks
In the Islamic Countries
109
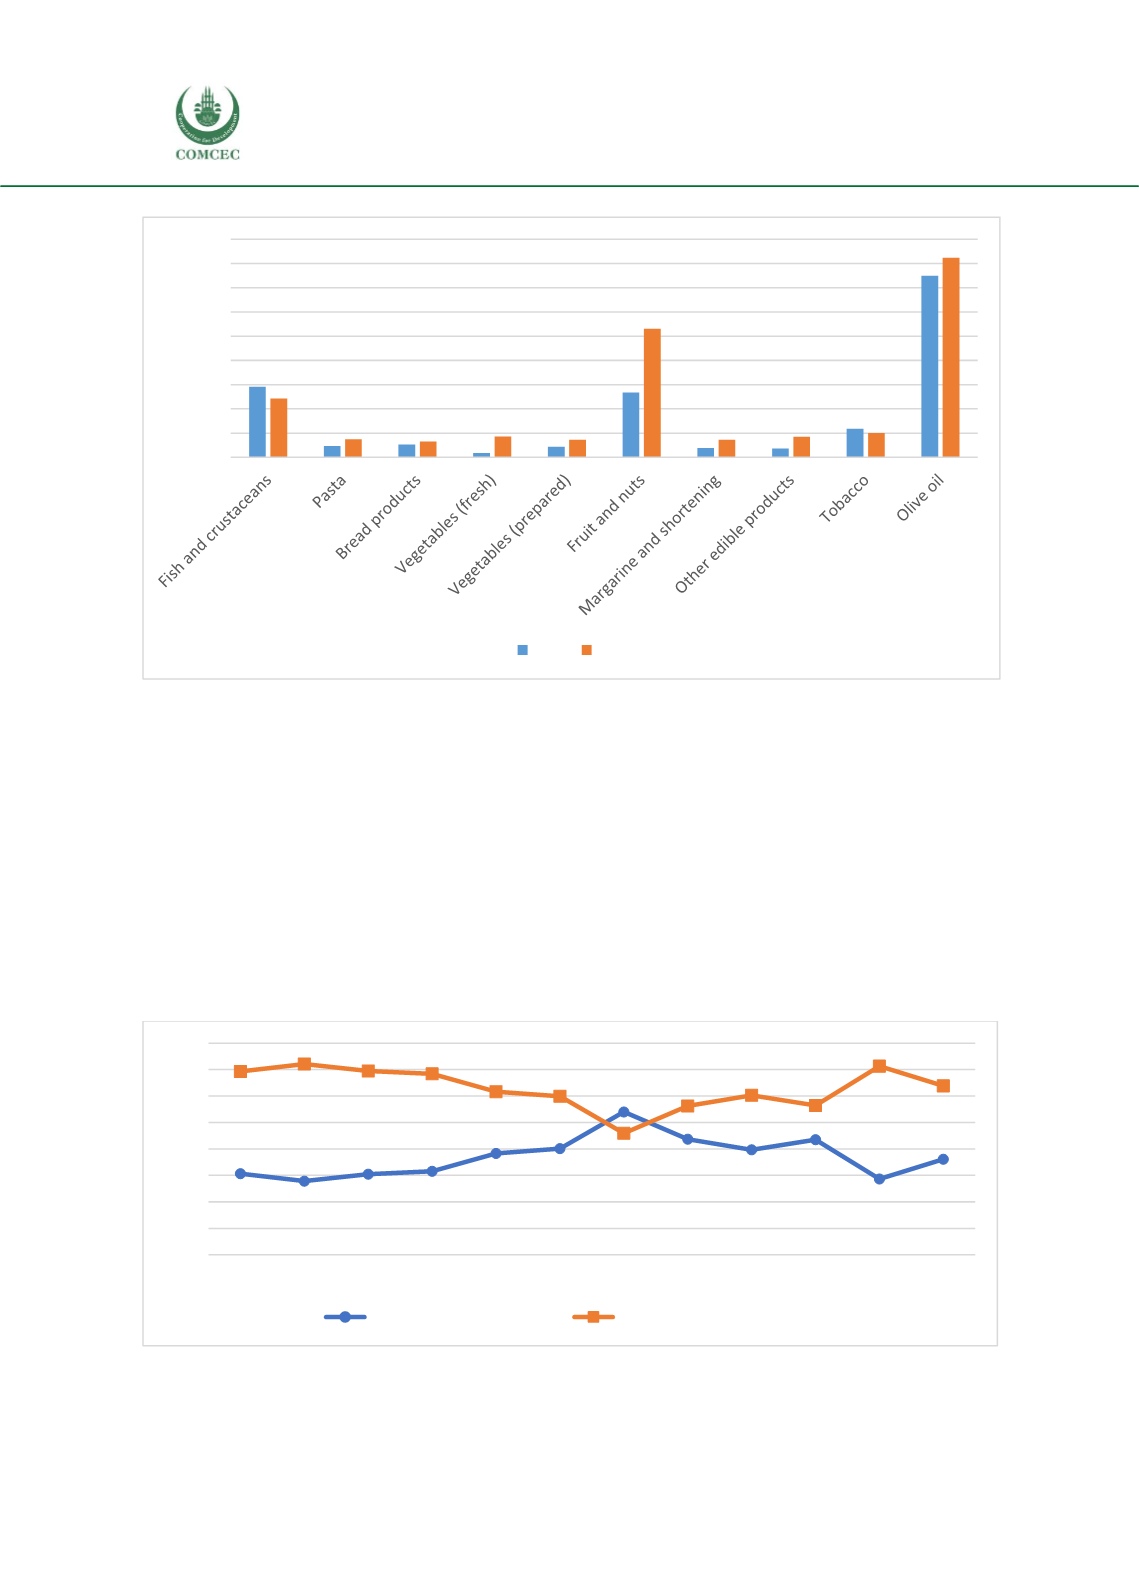
Figure 52:
Value of Tunisia’s Main Exports, by Disaggregated Product, 2005 and 2016, Million USD
Source: UN Comtrade.
Market structure and networks of agricultural exports
Italy, Libya, Spain, France, the United States, Morocco and Algeria were Tunisia's 7 main
agricultural export destinations during the period between 2005 and 2016. In 2016, about 32%
of Tunisia's total agricultural exports went to OIC member countries. Among the OIC members,
the Arab countries are the most important export destinations, with a share equal to 25.7% of
total exports of agricultural products.
The share of OIC member countries in agri-food exports increased significantly from 30.7% in
2005 to 54% in 2011. This share decreased afterwards to 36.1% in 2016. Overall, the share of
agri-food exports to OIC member countries is below that for non-OIC members.
Figure 53: Trends in Tunisian Agri-Food Products Export Destinations, 2005-2016, Percent
Source: UN Comtrade
0
50
100
150
200
250
300
350
400
450
2005 2016
0%
10%
20%
30%
40%
50%
60%
70%
80%
2005 2006 2007 2008 2009 2010 2011 2012 2013 2014 2015 2016
Exports OIC countries
Exports non-OIC countries