


 124 / 152

Analysis of Agri-Food Trade Structures
To Promote Agri-Food Trade Networks
In the Islamic Countries
107
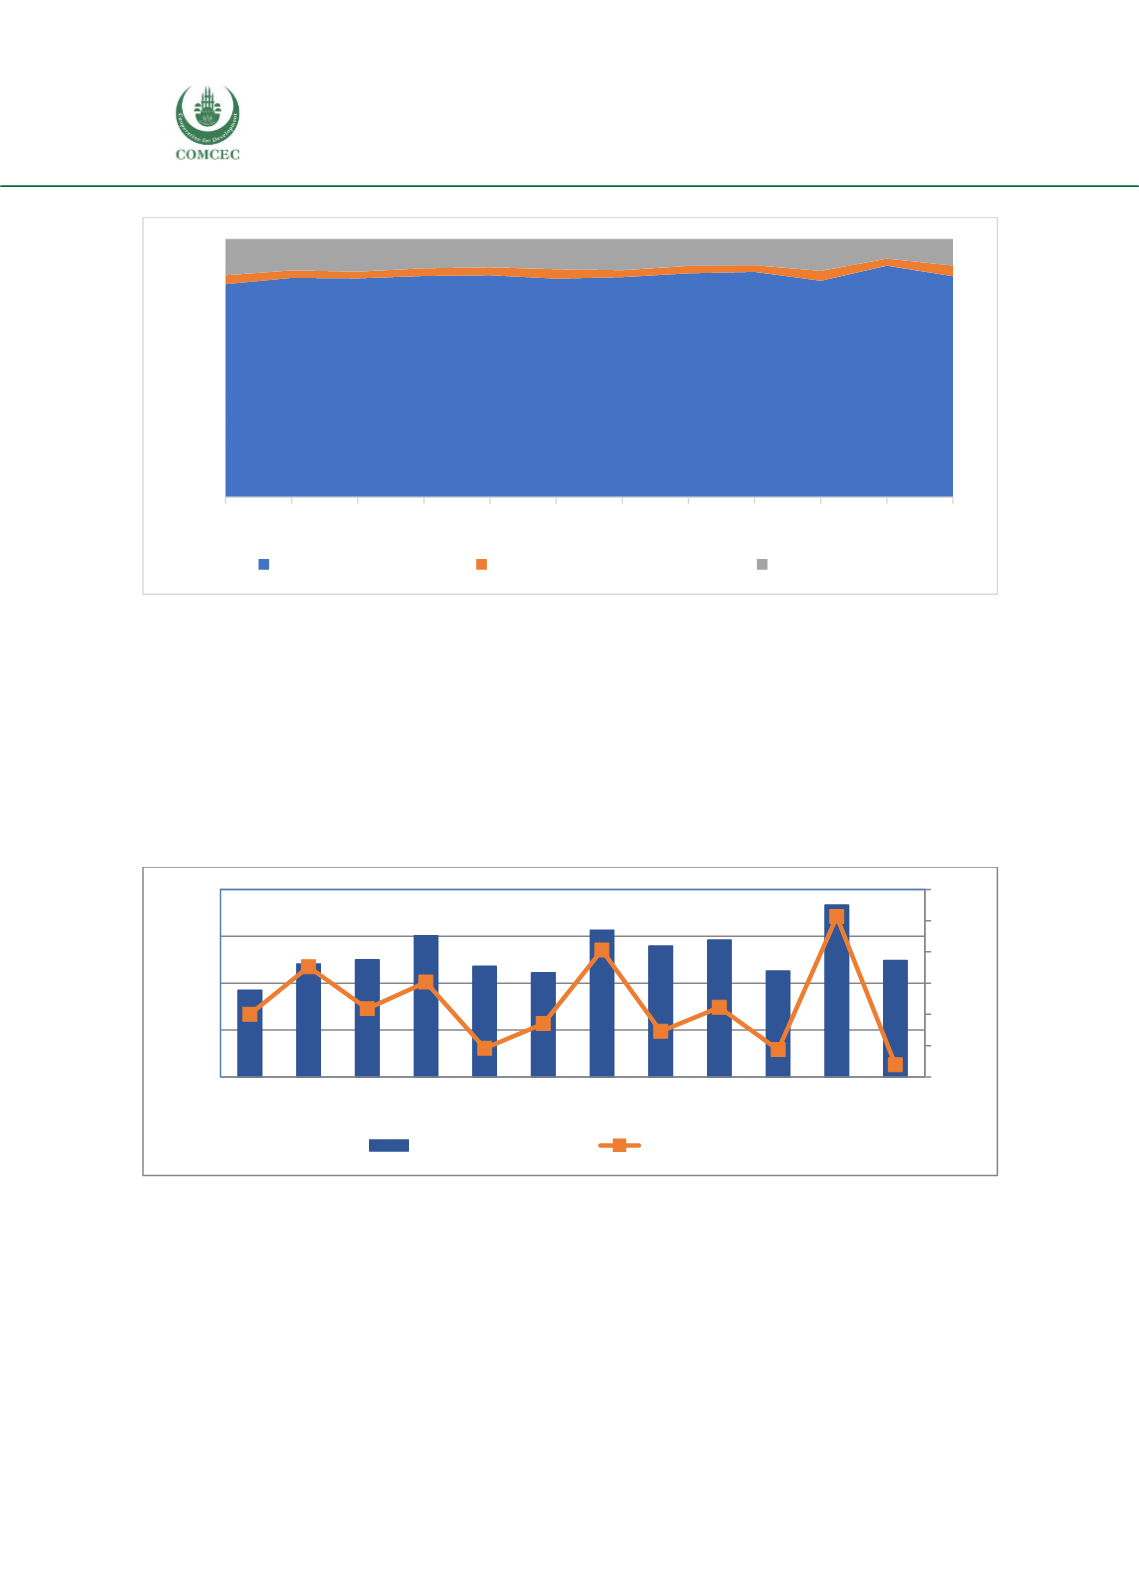
Figure 48: Composition and Evolution of Export of Agricultural Products, 2005-2016
Source: UN Comtrade.
As for detailed sub-sector analysis, between 2005 and 2016, exports of agri-food products
fluctuated sharply (lack of stability in the evolution). Indeed, each increase is followed by a fall
in exports during the following year. A record was achieved in 2015 with 1833.8 million USD.
For agricultural rawmaterials, during the period 2005-2016, exports are quite low. On the other
hand, an upward trend has been observed since 2013 althoughit is necessary to consider the
impact of exchange rate and quantity effects. The tunisian dinar experienced a continuous
depreciation during this period, whichexplains this increase.
Figure 49: Trends in Agri-Food Exports of Tunisia, 2005-2016, Million USD
Source: UN Comtrade.
0%
10%
20%
30%
40%
50%
60%
70%
80%
90%
100%
2005 2006 2007 2008 2009 2010 2011 2012 2013 2014 2015 2016
Agri-Food Products
Agricultural Raw Materials
Fish Products
-40%
-20%
0%
20%
40%
60%
80%
0
500
1.000
1.500
2.000
2005 2006 2007 2008 2009 2010 2011 2012 2013 2014 2015 2016
Agri-Food Products
Growth Rate (%)