


 129 / 152

Analysis of Agri-Food Trade Structures
To Promote Agri-Food Trade Networks
In the Islamic Countries
112
Import of Agricultural Products
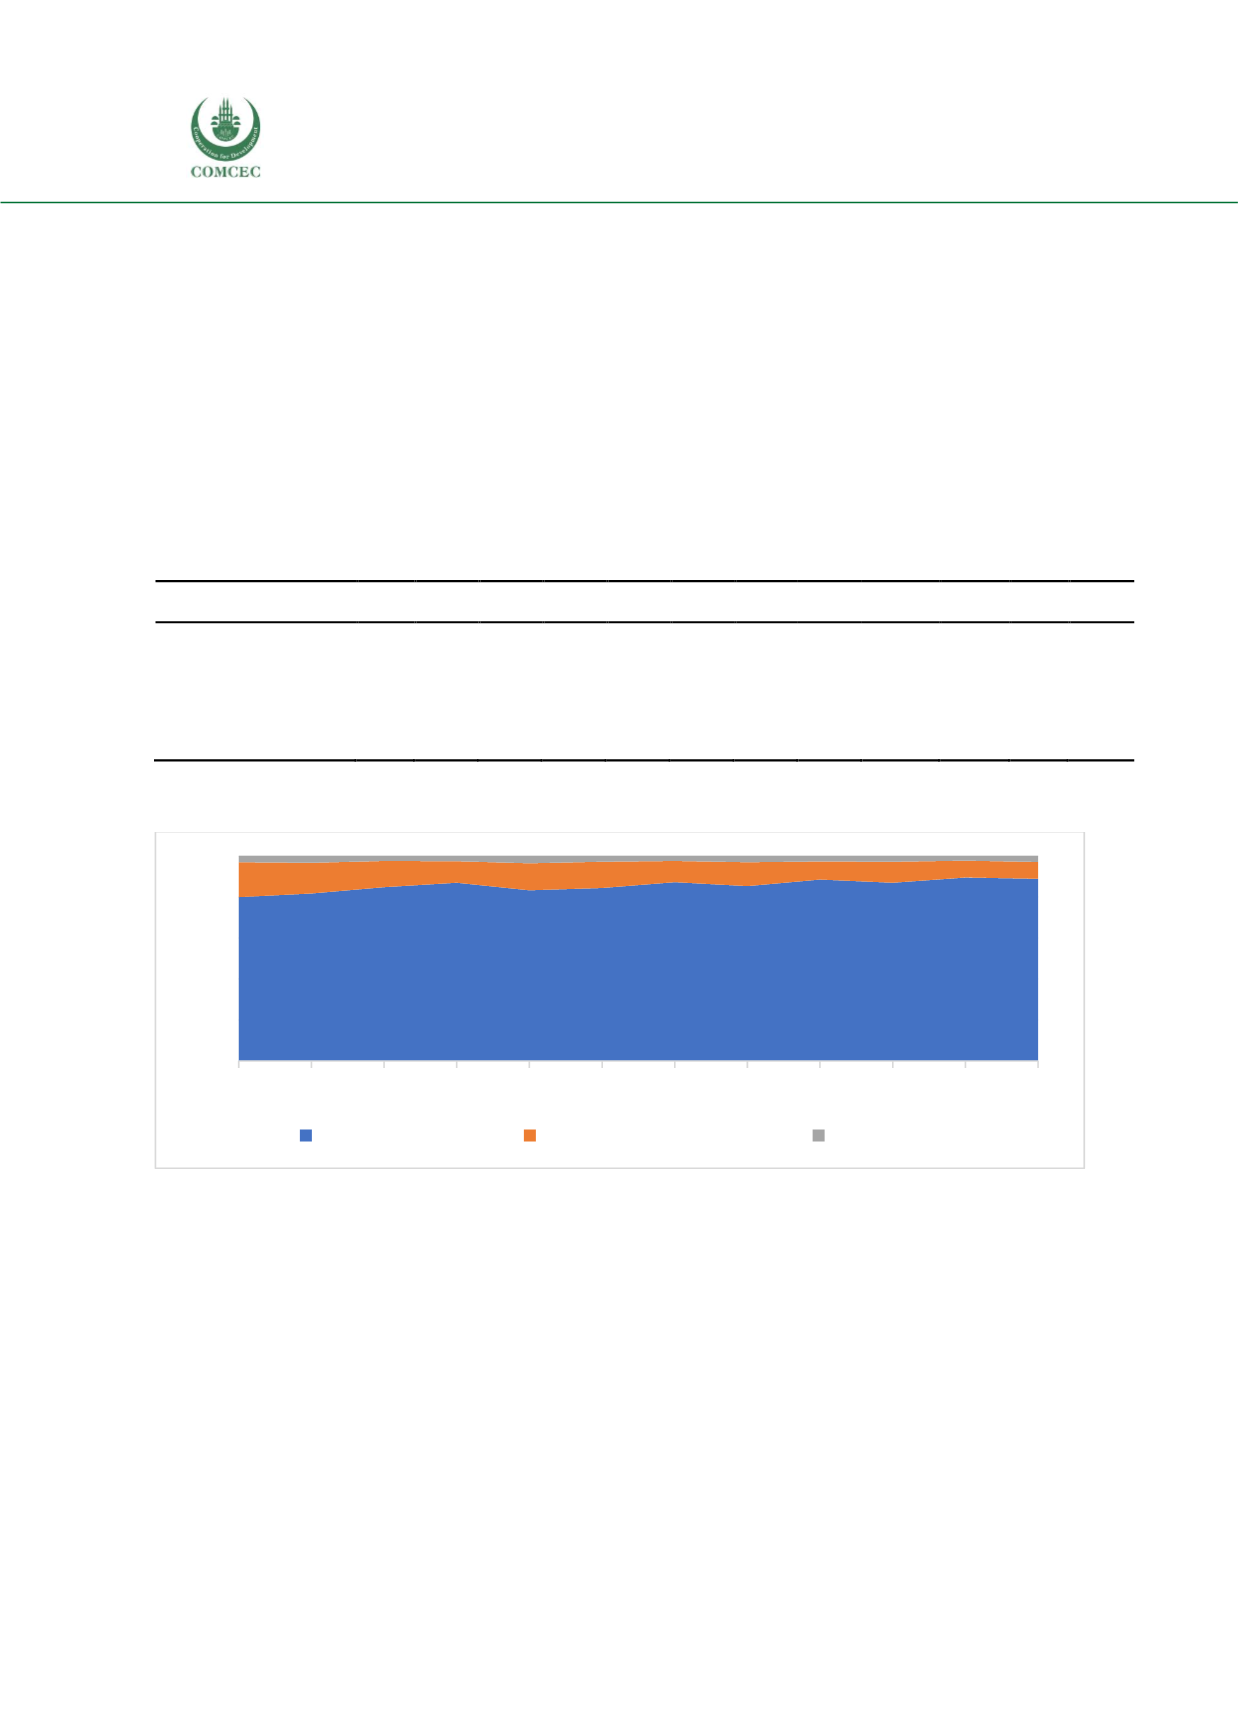
Composition and patterns of agricultural imports
Analysing imports, agricultural products imports grew significantly from 1330 million USD in
2005 to 2351.1 million USD in 2016, representing an increase of 76.7%. Agri-food products is
the main category in Tunisia's agricultural imports, followed by imports of agricultural raw
materials. In fact, agri-food imports increased from1063.4 million USD in 2005 to 2090.9million
USD in 2016. By contrast, imports of agricultural raw materials increased from in the first part
of the sample, but declined in 2015 and 2016, while imports of fishery products increased from
40.3 to 68.5 million US dollars over the same period. However, agri-food products account for
more than 80% of total agricultural imports (see Figure 57 and Table 28).
Table 28: Import Performance of Agricultural Products, 2005-2015, Million USD
Products
2005
2006
2007
2008
2009
2010
2011
2012
2013
2014
2015
2016
Agricultural Products
1,331 1,437 2,127 2,787 1,866 2,360 3,004 2,494 281,010 26,588 2,451 2,351
Agri-Food Products
1,063 11,744
1,804 24,233 15,544 19,944 26,222 21,287
24,877
2,312
2,193 20,911
Agricultural Raw Materials 2,277
215 27,070
2,944
2,466
300
3,099 29,090
2,488
270
2,022 1,922
Fish Products
40
488
533
71
677
677
744
77
755
76
56
699
Source: UN Comtrade retrieved through WITS.
Figure 57: Composition and Evolution of Tunisian Import of Agricultural Products, 2005-2016
Source: UN Comtrade retrieved through WITS.
Imports of agri-food products during the period 2005-2016 fluctuated and have experienced
three main phases:
1.
They increased continuously during the period 2005-2008, from 1,063.4 in 2005 to
2,422.9 million USD in 2008;
2.
Following a remarkable decline in 2009, imports of agri-food products increased again
from 1553.7 million USD in 2009 to 2621.9 million USD in 2011;
3.
Finally, imports of agri-food products declined steadily from 2486.8 million in 2013 to
2090.9 million USD in 2016. An exceptionally high level of imports was observed
during 2011, the year of the revolution of 14 January. Since 2013, the Tunisian
0%
20%
40%
60%
80%
100%
2005 2006 2007 2008 2009 2010 2011 2012 2013 2014 2015 2016
Agri-Food Products
Agricultural Raw Materials
Fish Products