


 122 / 152

Analysis of Agri-Food Trade Structures
To Promote Agri-Food Trade Networks
In the Islamic Countries
105
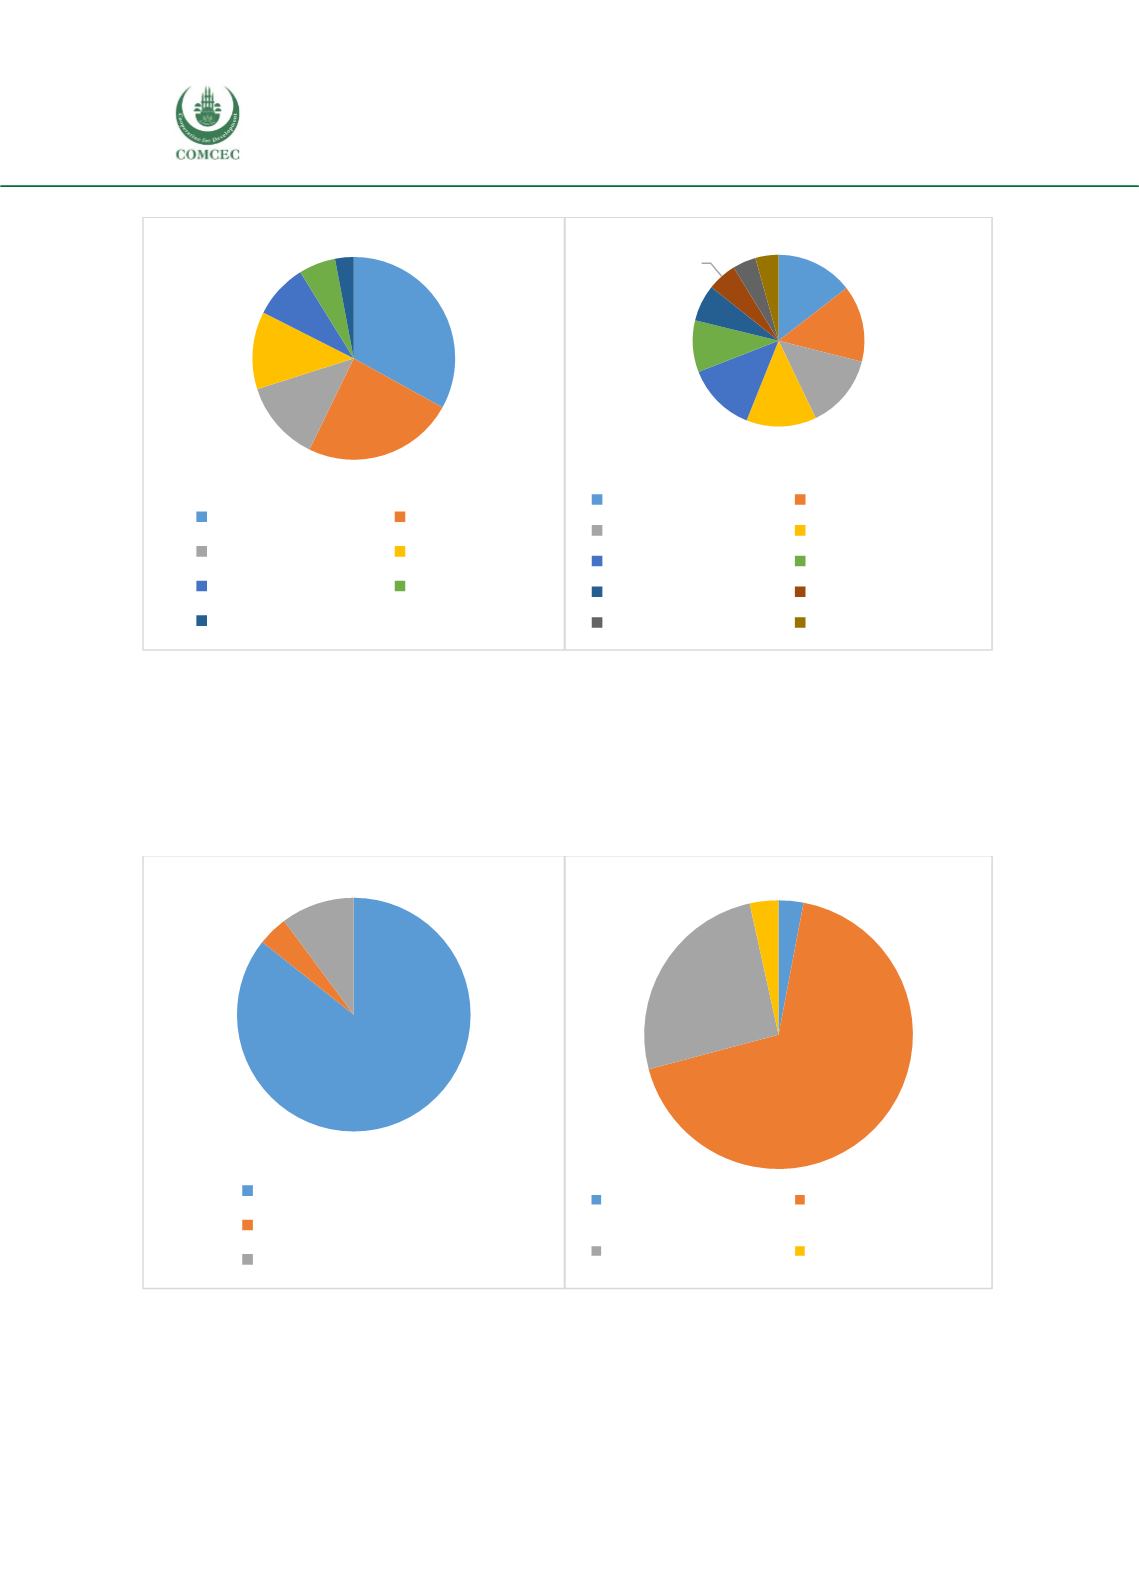
Figure 45: Main Trade Partners of Tunisia, 2005-2016, Percent
Source: UN Comtrade.
As for the product composition and the destination of trade flows, in 2016, Tunisia's exports
were mainly destined (67.9%) to non-OIC countries. The share of the OIC countries in exports is
only 32.1%, of which the Arab countries account for 25.7%. Also, agri-food products are
dominating the sector since they accounted for 85.7% of Tunisian exports of agricultural
products.
Figure 46: Product Composition and Direction of Agricultural Exports, 2016, Percent
Source: UN Comtrade.
33%
24%
13%
12%
9%
6% 3%
Italy
Libya
Spain
France
United States
Morocco
Algeria
15%
14%
14%
13%
13%
10%
7%
6%
4% 4%
Brazil
United States
France
Ukraine
Argentina
Italy
Russian Federation Spain
Germany
Canada
86%
4% 10%
Agri-Food Products
Agricultural Raw Materials
Fish Products
3%
68%
26%
3%
Asian OIC countries
non-OIC countries
Arab OIC countries
African OIC countries