
Improving Public Debt Management
In the OIC Member Countries
26
Refinancing Risk
Maturity
The maturity structure of public debt determines the share of debt that has to be refinanced in
a given year. The share of shortterm debt has been identified as an important determinant of
financial and sovereign debt crises. In the period preceding a crisis, shortterm debt financing
usually becomes more important because investors become reluctant to longterm lending. As
such, a high share of longterm debt is a sign of the confidence investors put in the economy.
There are many studies on the maturity structure of public debt (see, among others, Arellano
and Ramanarayanan 2012, Debortoli et al. 2014, Greenwood et al. 2015). Both governments
and investors face tradeoffs: while interest rates on shortterm debt are usually lower than on
longterm debt, shortterm debt is positively associated with refinancing risk. From the
perspective of investors longterm credits provide a hedge against future interest rate
fluctuations, but shortterm contracts are more effective in providing incentives to repay.
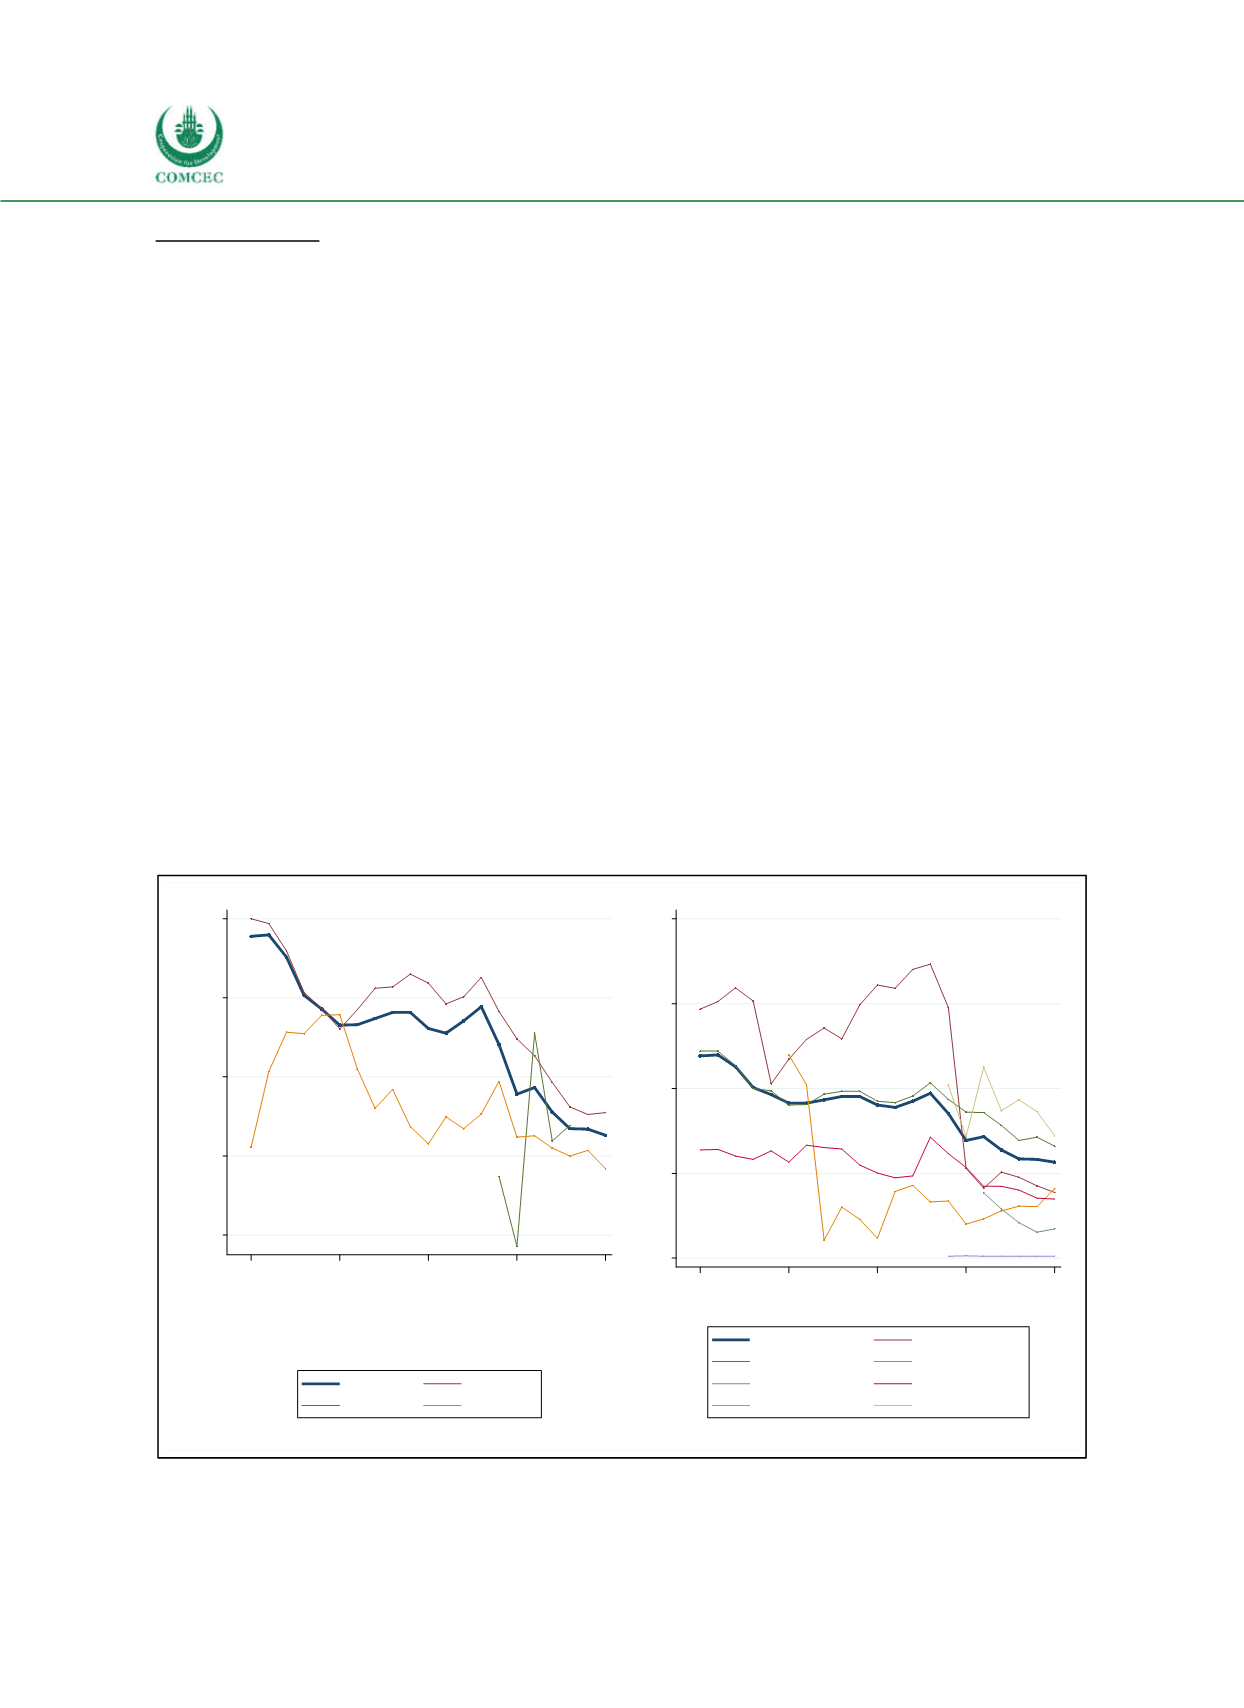
Shortterm debt is defined as debt with an original maturity of one year or less. Since 1995 a
substantial reduction in the share of shortterm debt has taken place (see Figure 27) (IMF and
World Bank 2016): The share of shortterm in total public debt averaged across all countries
decreased from 24% in 1995 to 11% in 2015. Lowincome countries have a lower share of
shortterm debt than highincome countries. Figure 28 shows the development of longterm
and shortterm public debt expressed as % of GDP. The increase in public debt since the global
financial crisis has been financed by longterm instruments; the share of shortterm debt in
GDP has remained relatively constant.
Figure 2-7: Share of Short-Term in Total Public Debt Worldwide
Sources: IMF and World Bank (2016), Quarterly Public Sector Debt database, calculations by the Ifo Institute
Note: Due to missing data the graphs for low income countries (left panel) and for Latin America & Carib., Sub-
Saharan Africa, South Asia & MENA (right panel) cover a shorter time period only.
5
10
15
20
25
%
1995
2000
2005
2010
2015
Year
All
High income
Low income
Middle income
0
10
20
30
40
%
1995
2000
2005
2010
2015
Year
All
East Asia, Pacific
Europe, Central Asia
Latin America & Carib.
MENA
North America
South Asia
Sub-Saharan Africa


