
Improving Public Debt Management
In the OIC Member Countries
32
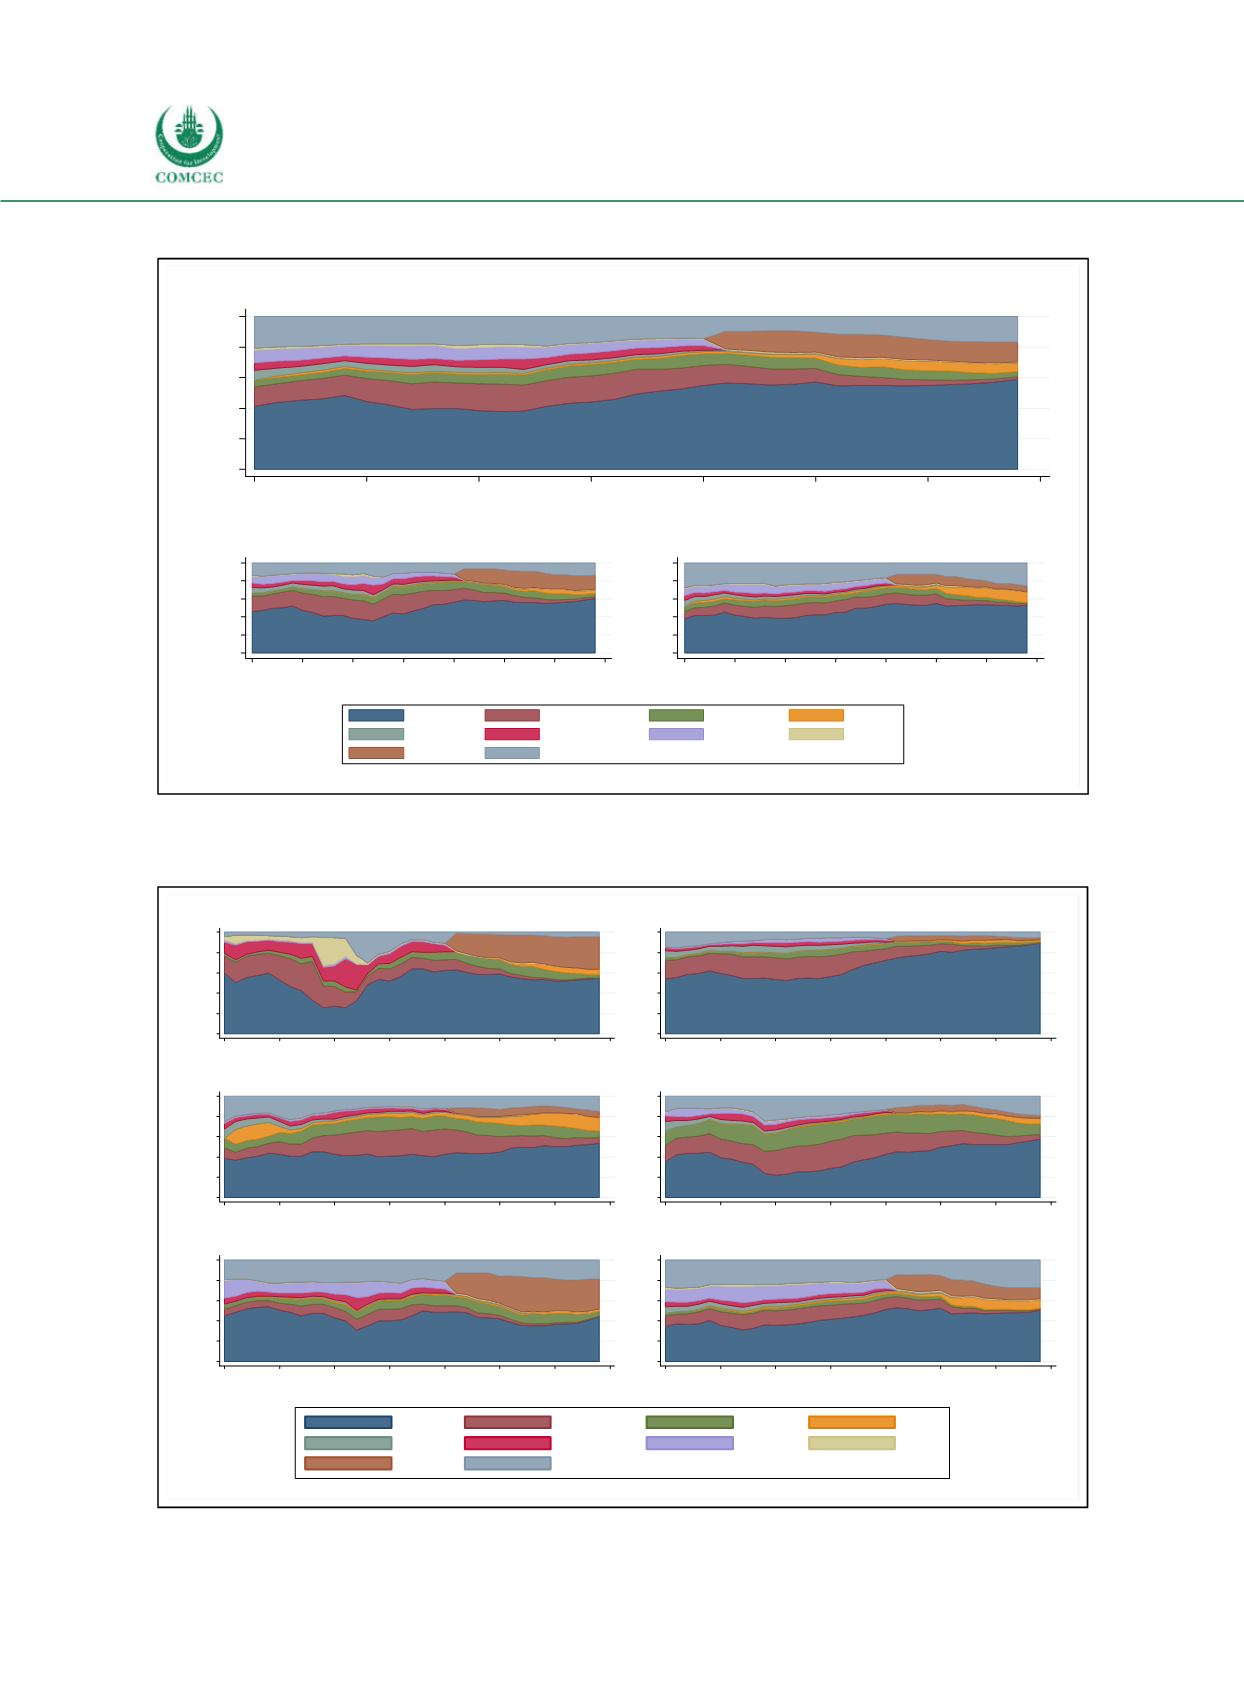
Figure 2-13: Currency Composition of Public Debt by Income Groups Worldwide
Sources: World Bank (2016) International Debt Statistics, calculations by the Ifo Institute.
Figure 2-14: Currency Composition of Public Debt by Regional Groups Worldwide
Sources: World Bank (2016) International Debt Statistics, calculations by the Ifo Institute.
0
20
40
60
80
100
%
1980
1985
1990
1995
2000
2005
2010
2015
Year
All countries
0
20
40
60
80
100
%
1980 1985 1990 1995 2000 2005 2010 2015
Year
Middle income
0
20
40
60
80
100
%
1980 1985 1990 1995 2000 2005 2010 2015
Year
Low income
USD
Multiple
Yen
SDR
Pound
DM
FFranc
SFranc
Euro
Unspecified
0
20
40
60
80
100
%
1980
1985
1990
1995
2000
2005
2010
2015
Year
Europe, Central Asia
0
20
40
60
80
100
%
1980
1985
1990
1995
2000
2005
2010
2015
Year
Latin America & Carib.
0
20
40
60
80
100
%
1980
1985
1990
1995
2000
2005
2010
2015
Year
South Asia
0
20
40
60
80
100
%
1980
1985
1990
1995
2000
2005
2010
2015
Year
East Asia, Pacific
0
20
40
60
80
100
%
1980
1985
1990
1995
2000
2005
2010
2015
Year
MENA
0
20
40
60
80
100
%
1980
1985
1990
1995
2000
2005
2010
2015
Year
Sub-Saharan Africa
USD
Multiple
Yen
SDR
Pound
DM
FFranc
SFranc
Euro
Unspecified


