
Improving Public Debt Management
In the OIC Member Countries
23
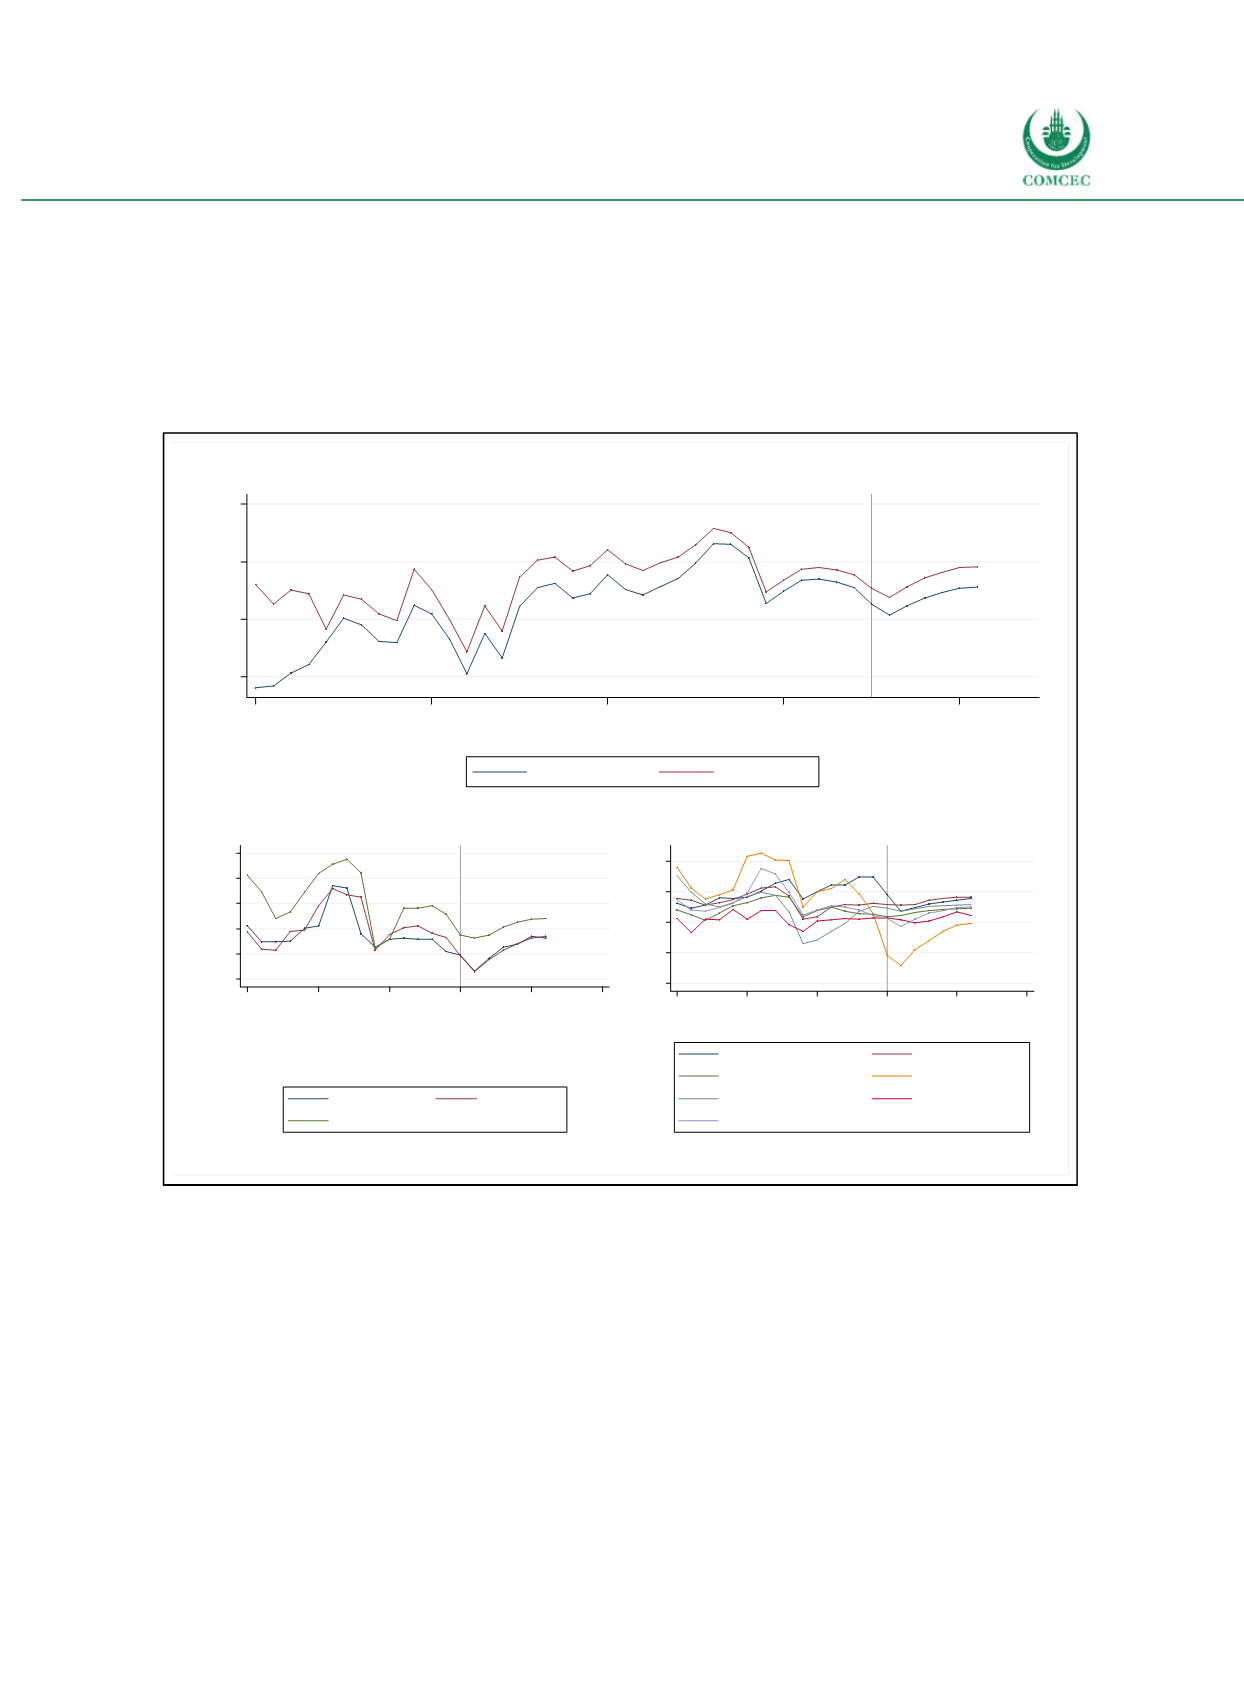
the primary balance. Because of the low interest rate environment, the difference between
both measures has become smaller in the recent past. While the average budget deficit was
7.2% of GDP during the period 19801995, average budget deficits drastically decreased to
1.4% over the period 19962006. However, the global financial crisis has marked a structural
break and pushed balances deeper into deficit, where they will remain in coming years
according to the projections.
Figure 2-4: Government Net Lending Worldwide
Source: WEO (2016), calculations by the Ifo Institute.
The classification according to the income level (lower left panel) shows a remarkable
improvement in government budget balances in lowincome countries. While historically they
ran much larger deficits, their behavior does not differ much from the behavior observed in
middleand highincome countries from 2000 onwards. The regional data (lower right panel)
reveal that the improvement in lowincome countries can be traced back to countries in SubSaharan Africa. This development might be partially attributed to debt relief programs which
were implemented over the last two decades. The volatility observed in Middle Eastern and
North African (MENA) countries is pronounced, which could be due to the role of commodities,
especially oil and gas, as a major source of government revenues. While the MENA countries
ran large surpluses between 2004 and 2008, they currently display the largest deficit of all
-10
-5
0
5
Share of GDP (in %)
1980
1990
2000
2010
2020
Year
General balance
Primary balance
Projections
-6
-4
-2
0
2
4
Share of GDP (in %)
2000
2005
2010
2015
2020
2025
Year
Low income
Middle income
High income
Projections
-15
-10
-5
0
5
Share of GDP (in %)
2000
2005
2010
2015
2020
2025
Year
East Asia, Pacific
Europe, Central Asia
Latin America & Carib.
MENA
North America
South Asia
Sub-Saharan Africa
Projections


