
Improving Public Debt Management
In the OIC Member Countries
21
become more pronounced since the middle of the first decade of the 2000s: while debt has
been increasing in highincome countries, debt drastically decreased in lowincome countries.
Debt in lowincome countries shows the largest volatility over time. Different dynamics can
also be observed within the regional country groups: countries in the Middle East and North
Africa and, to a lower extent, those in SubSaharan Africa show a substantial and continuous
reduction of debt levels over the past 20 years. After reaching a peak in the early 2000s, debt
levels in East and South Asia have been decreasing. Debt levels in Latin America and the
Caribbean showed relatively constant values in the recent past. North America, Europe and
Central Asia have increased their debt levels significantly since 2007.
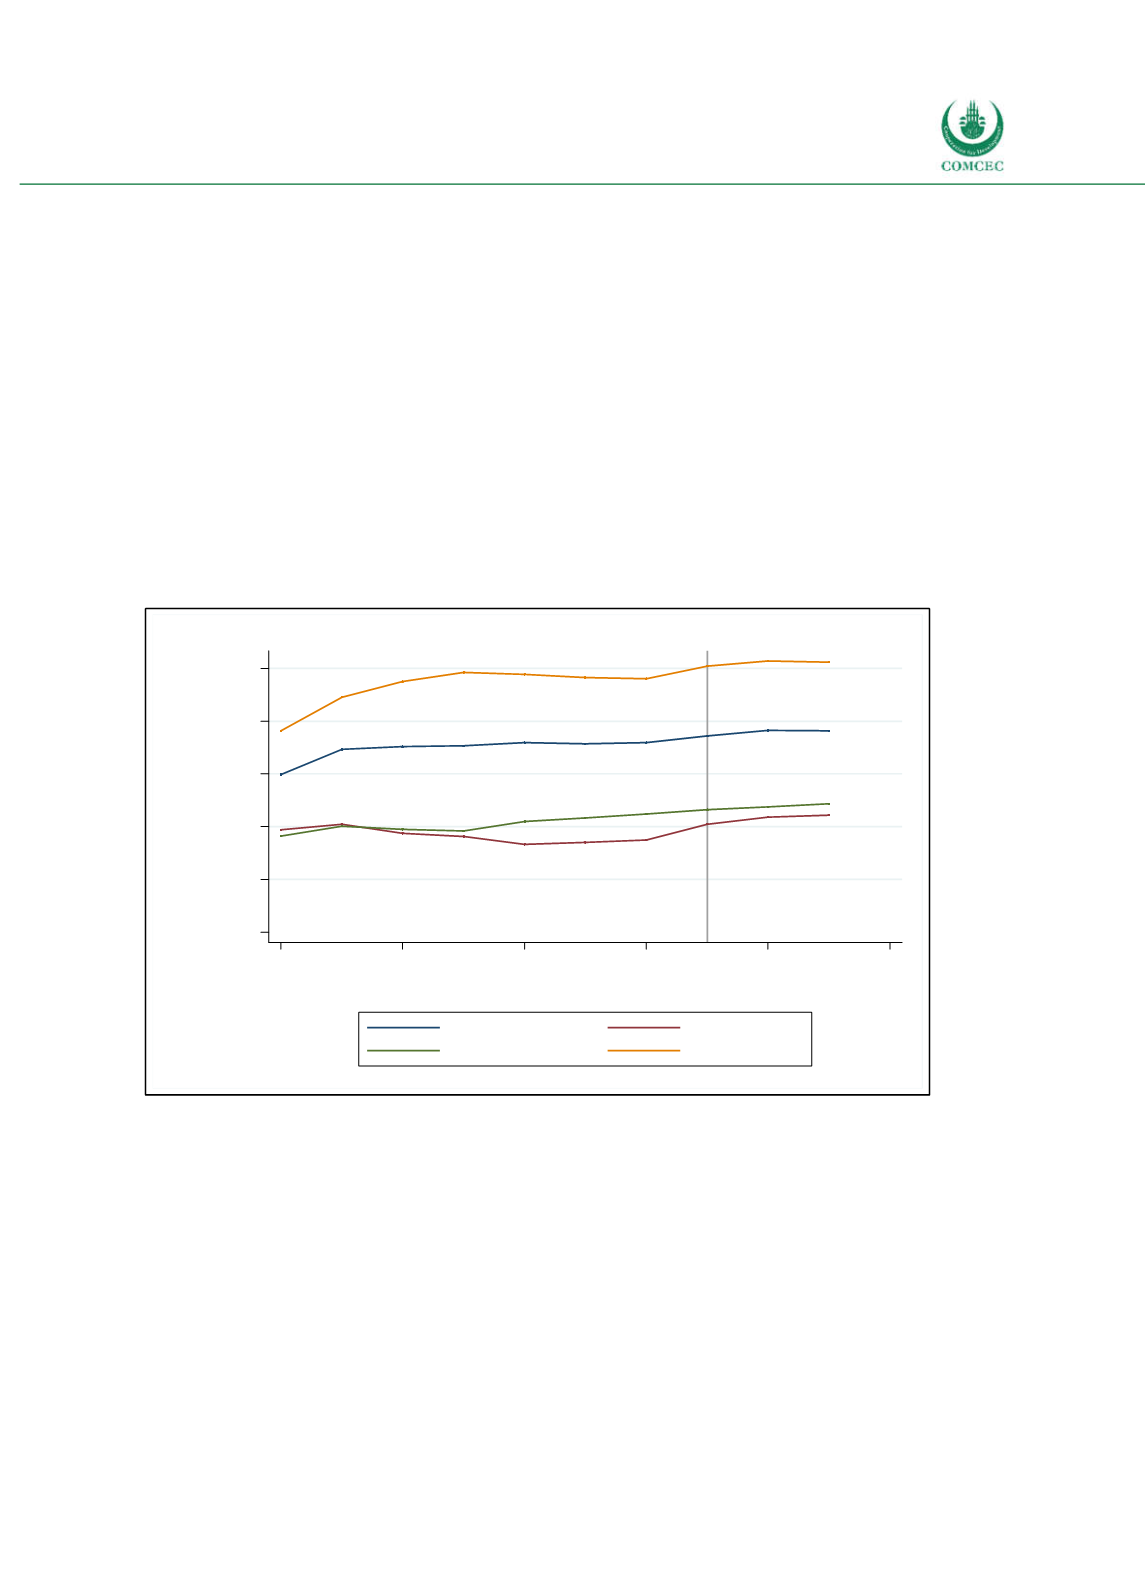
Figure 22 zooms into the more recent period starting in 2008 and presents debt classified
according to income level. Average debt ratios in highincome countries are more than twice as
large as in middleincome and lowincome countries. Debt crises and financial crises in many
advanced countries are responsible for the debt increases until 2011; ratios in middleincome
and lowincome countries, in turn, remained relatively stable.
Figure 2-2: Gross Public Debt Worldwide Since 2008
Sources: WEO (2016), calculations by the Ifo Institute.
Figure 23 provides an alternative way to illustrate global debt developments: it shows the
unconditional distribution of sovereign debt levels (in % of GDP) in selected years for those
countries for which data is available in the IMF World Economic Outlook (WEO 2016).
Histograms and kernel densities portray an increasing concentration of sovereign debt ratios
since 2010 compared to the previous period. While more countries are concentrated at values
around 50%, the number of outliers with high debt levels has also risen. The mean is always
larger than the median. Nevertheless, the standard deviation has decreased. The distribution
has become steeper with more mass being concentrated in the center.
0
20
40
60
80
100
Share of GDP (in %)
2008
2010
2012
2014
2016
2018
Year
All
Low income
Middle income
High income
Projections


