
Improving Public Debt Management
In the OIC Member Countries
22
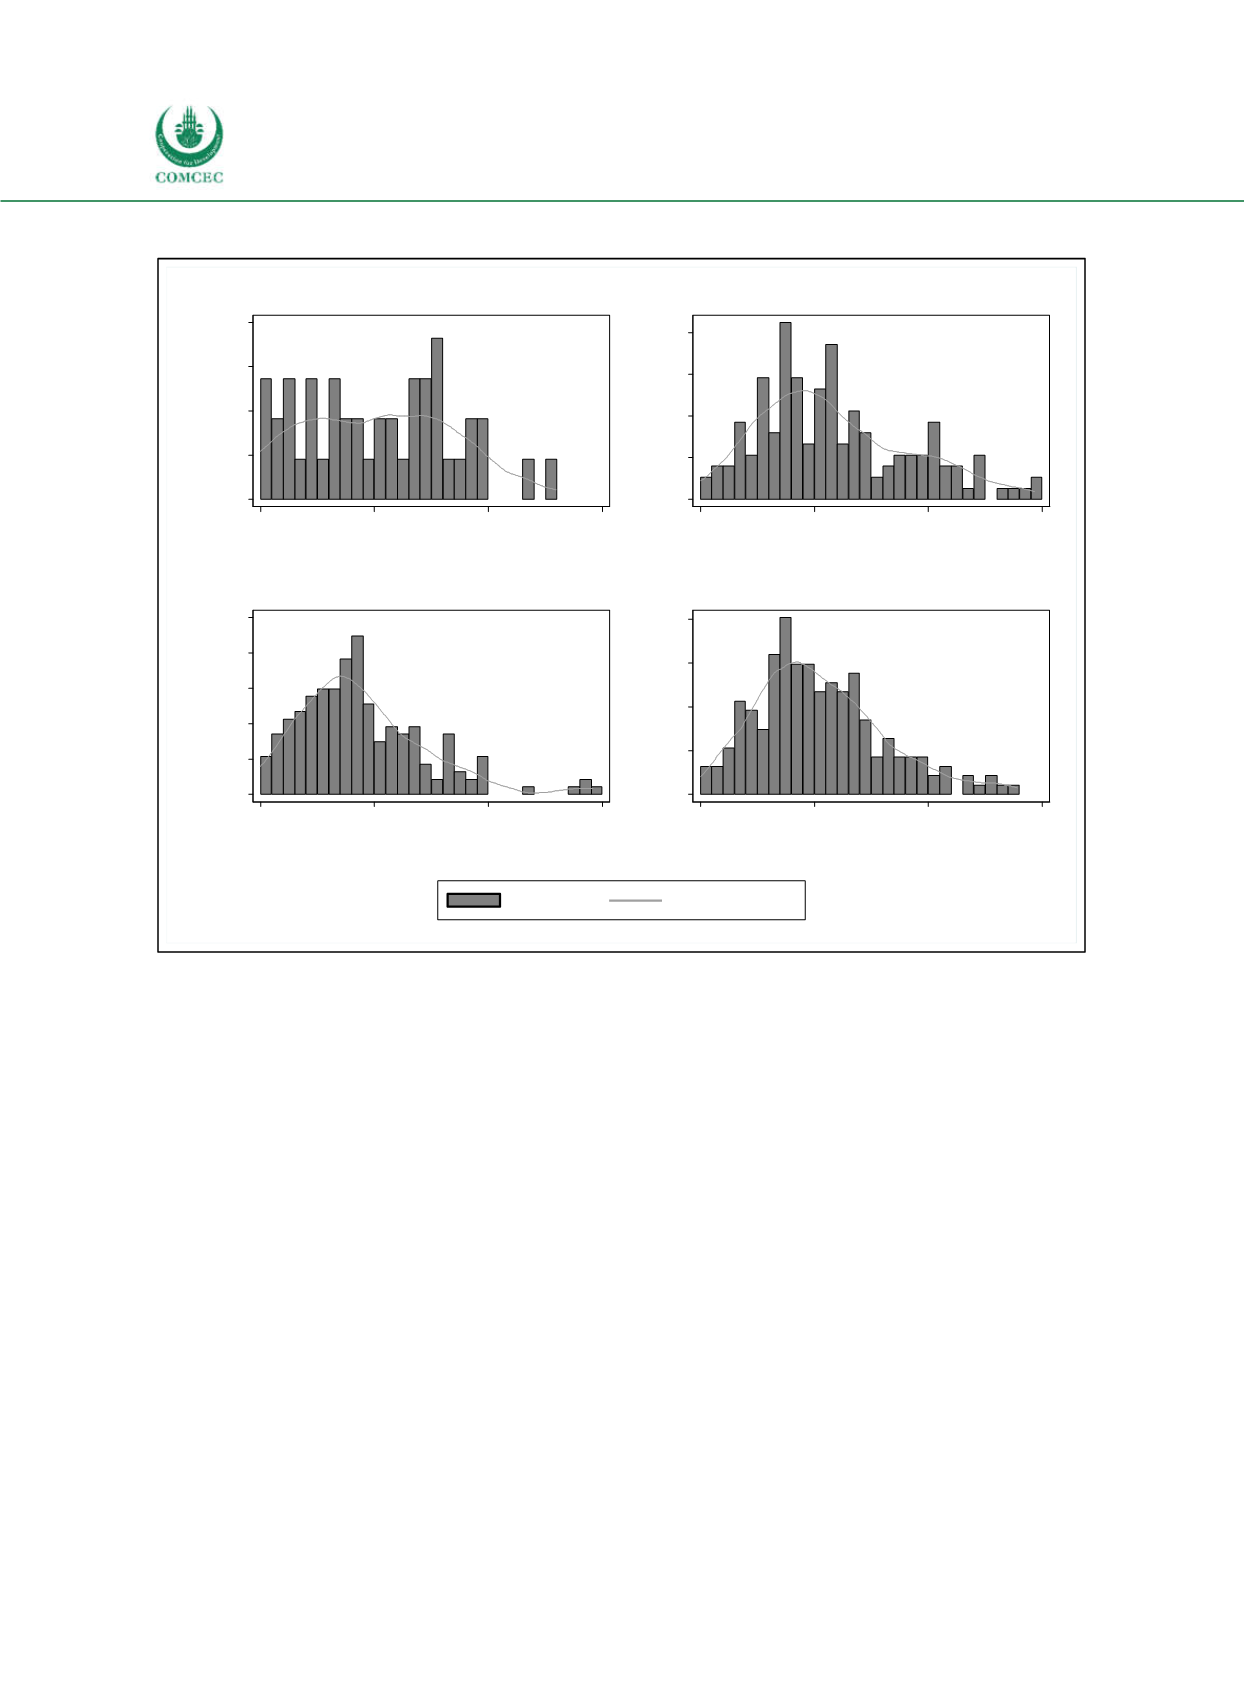
Figure 2-3: Distribution of Gross Public Debt to GDP Ratios Worldwide
Notes: The histograms show the distribution of gross government debt levels (in % of GDP) for the years 1990,
2000, 2010 and 2015. Each graph includes all countries for which data are available in the IMF World Economic
Outlook (WEO 2016). Outliers with debt values larger than 150% of GDP were dropped. The bin width amounts to
5 percentage points. The line graph plots a kernel density estimate for ratios of government debt over GDP. As
kernel-weight function the function of Epanechnikov is used. The width of the density window is computed as that
width that would minimize the mean integrated squared error if data were from a normal distribution and a
Gaussian kernel was used.
Sources: WEO (2016), calculations by the Ifo Institute.
2.1.2
Government Budgets
Scaling debt levels by GDP implies that for balanced government budgets falling debt ratios in
periods of economic growth and increasing debt ratios in recessionary periods (characterized
by a reduction in GDP) can be observed. In addition, given that for many lowand middleincome countries a substantial share of their government debt is denominated in foreign
currencies (see Section 2.1.3), exchange rate changes affect the measure of government debt.
In particular, a depreciation of the domestic currency increases debt expressed relative to GDP.
To isolate the effect of fiscal policy on government debt, it is therefore warranted to consider
the government budget balance.
The upper panel of Figure 24 shows averages across countries for two measures: the general
budget balance and the primary budget balance, which excludes interest payments on
outstanding debt. As governments are net debtors on average, the general balance lies below
0.00
0.01
0.01
0.01
0.02
Density
0
50
100
150
Gross government debt (in % of GDP)
Statistics: median: 56.3; mean: 63.8; std.dev: 53.0
1990
0.00
0.01
0.01
0.01
0.02
Density
0
50
100
150
Gross government debt (in % of GDP)
Statistics: median: 55.2; mean: 67.6; std.dev: 61.0
2000
0.00
0.01
0.01
0.01
0.02
0.03
Density
0
50
100
150
Gross government debt (in % of GDP)
Statistics: median: 40.3; mean: 46.0; std.dev: 31.5
2010
0.00
0.01
0.01
0.01
0.02
Density
0
50
100
150
Gross government debt (in % of GDP)
Statistics: median: 48.7; mean: 54.1; std.dev: 32.6
2015
Density
Kernel density


