
Improving Public Debt Management
In the OIC Member Countries
27
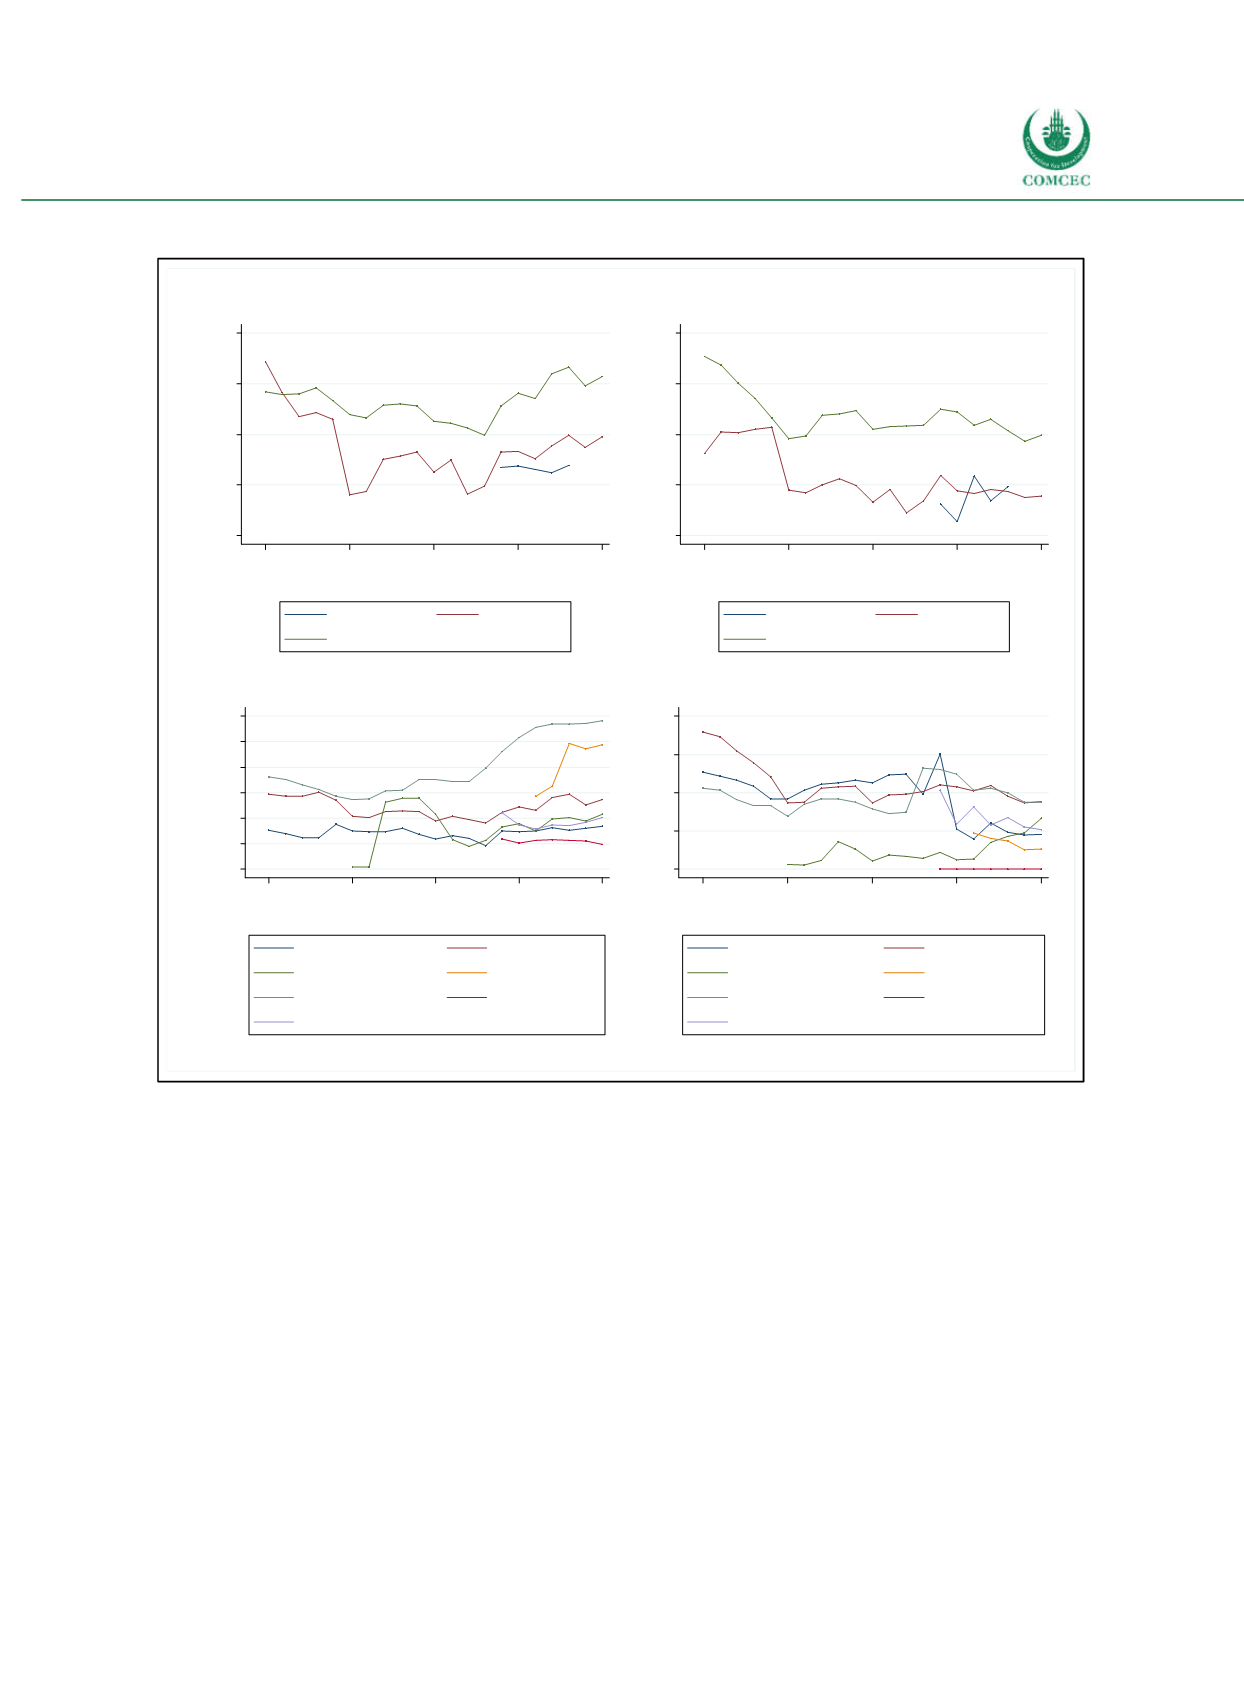
Figure 2-8: Long-Term and Short-Term Public Debt Worldwide
Sources: IMF and World Bank (2016), Quarterly Public Sector Debt database, calculations by the Ifo Institute
Note: Due to missing data the graphs for low income countries (upper panels) and for Latin America & Carib.,
Sub-Saharan Africa, South Asia & MENA (lower panels) cover a shorter time period only.
If a country pursues an active policy to lengthen the average maturity of its public debt by
issuing relatively more longterm bonds, this manifests itself only with a lag in the average
maturity of the stock of outstanding debt. As an alternative measure the average maturity on
all new public and publicly guaranteed loans contracted during a year will be presented (see
Figure 29). The average maturity for a given country is calculated by weighting maturities by
the amounts of the loans.
The upper panel of Figure 29 shows that the average maturity of new debt commitments has
been relatively stable over time and has fluctuated between 20 and 25 years. However, there is
an important difference with respect to the nature of the creditor: Private creditors extend
their credit for an average period of approximately 5 years. Creditors providing their financial
resources for periods exceeding a decade are typically official creditors. Official creditors are
international organizations such as the World Bank, regional development banks and other
0
20
40
60
80
Share of GDP (in %)
1995
2000
2005
2010
2015
Year
Low income
Middle income
High income
Long-term
0
5
10
15
20
Share of GDP (in %)
1995
2000
2005
2010
2015
Year
Low income
Middle income
High income
Short-term
0
20
40
60
80
100
120
Share of GDP (in %)
1995
2000
2005
2010
2015
Year
East Asia, Pacific
Europe, Central Asia
Latin America & Carib.
MENA
North America
South Asia
Sub-Saharan Africa
Long-term
0
5
10
15
20
Share of GDP (in %)
1995
2000
2005
2010
2015
Year
East Asia, Pacific
Europe, Central Asia
Latin America & Carib.
MENA
North America
South Asia
Sub-Saharan Africa
Short-term


