
Improving Public Debt Management
In the OIC Member Countries
24
country groups (10.4% in 2015). It is noted that many countries in this region belong to the
OIC.
2.1.3
Debt Structures
When evaluating fiscal sustainability, key parameters to consider are debt levels and budget
deficits, which enter the intertemporal budget constraint. Besides these “hard” figures, the
structure of public debt provides important information about the risks entailed in public debt.
Consequently, by turning to an analysis of debt structures, a picture of the maturity structure,
currency composition and interest rate types of public debt is drawn. In addition, it will be
distinguished between domestic and foreign as well as private and official creditors.
Creditors
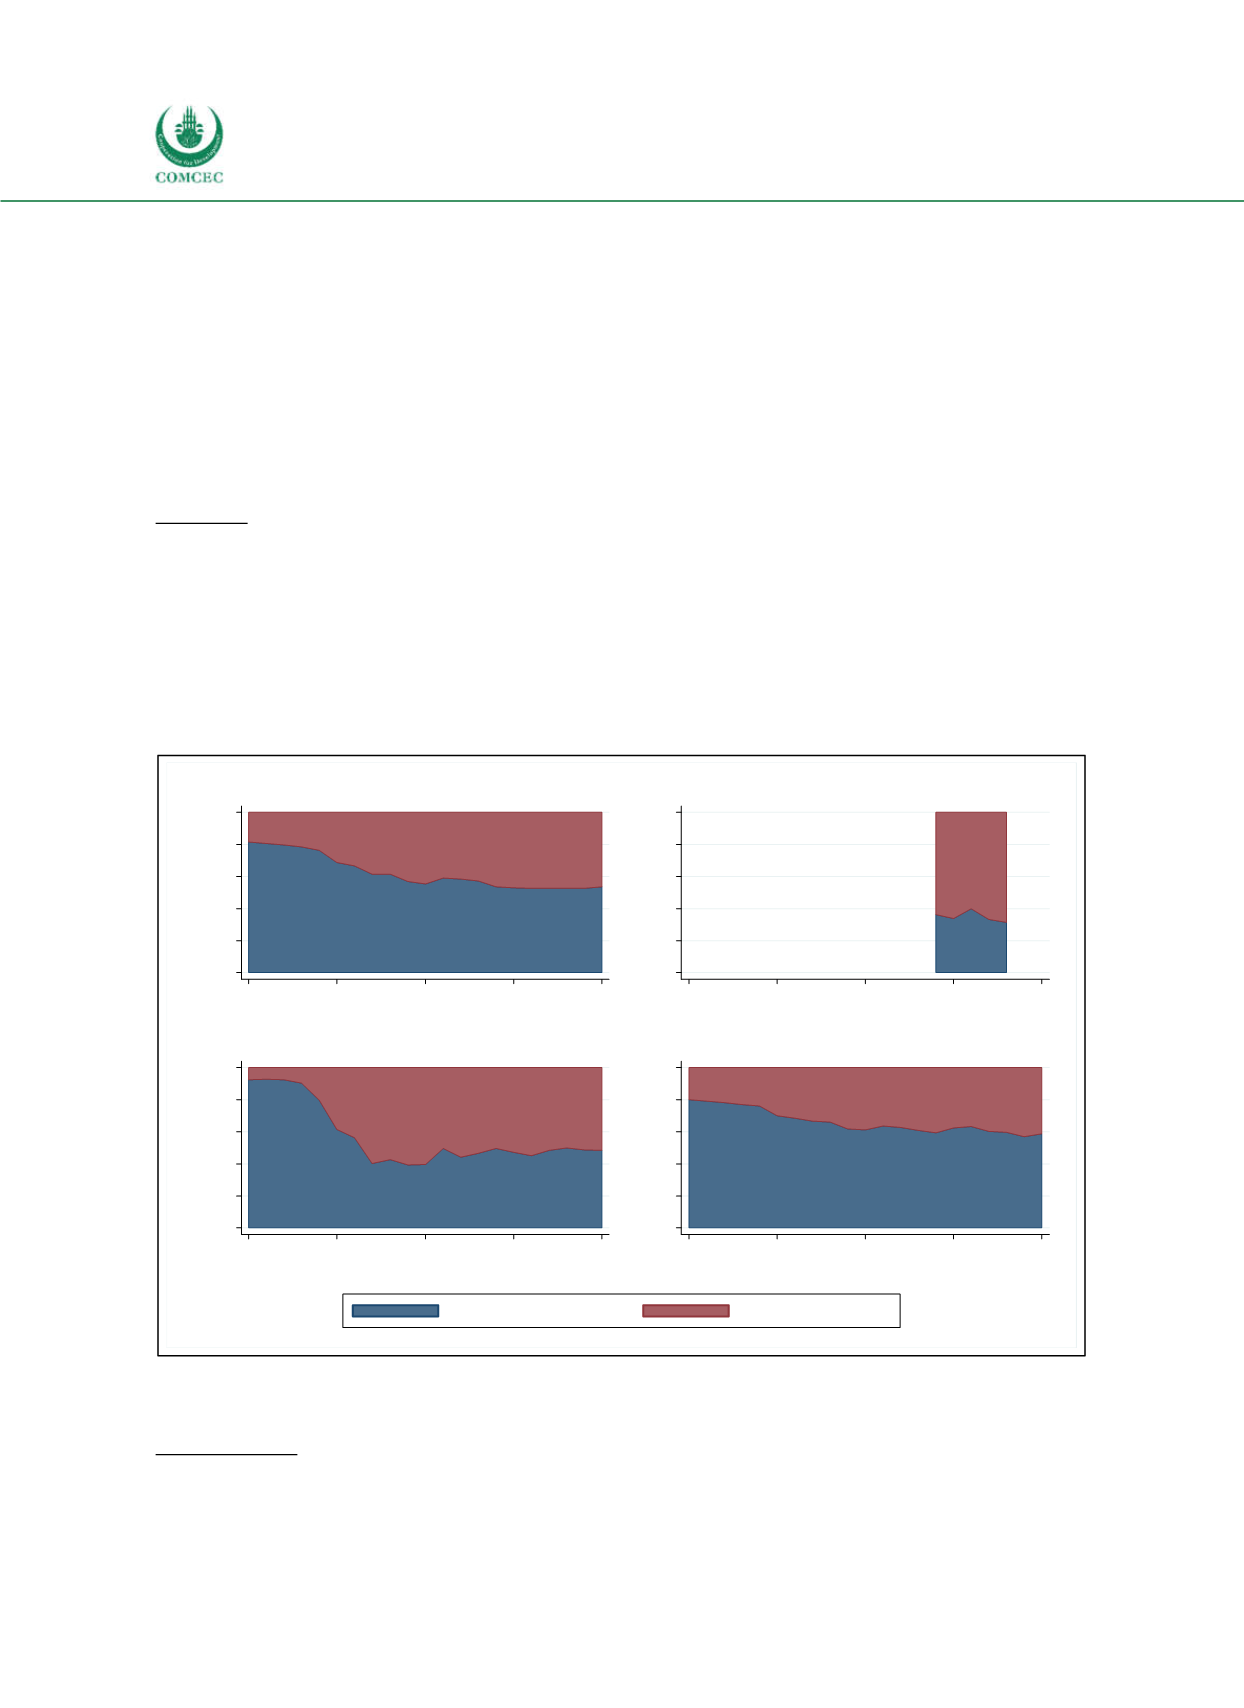
Who lends to governments? Financial resources might be provided by domestic or foreign
creditors. As shown in Figure 25 there is a substantial difference in the residence of creditors
between different income groups: Highincome countries rely mostly on domestic creditors
(59% in 2015), middleincome countries divide their financing needs equally between both
types of investors and lowincome countries only sold 31% of their liabilities to domestic
creditors.
Figure 2-5: Creditor Structure of Public Debt Worldwide
Sources: IMF and World Bank (2016), Quarterly Public Sector Debt database, calculations by the Ifo Institute.
Note: Due to missing data the graph for low income countries covers a shorter time period only.
Grant Element
Individual countries may be unable to finance themselves on international capital markets.
Macroeconomic instability, political uncertainty and legal enforcement problems might deter
0
20
40
60
80
100
%
1995
2000
2005
2010
2015
Year
All income levels
0
20
40
60
80
100
%
1995
2000
2005
2010
2015
Year
Low income
0
20
40
60
80
100
%
1995
2000
2005
2010
2015
Year
Middle income
0
20
40
60
80
100
%
1995
2000
2005
2010
2015
Year
High income
Domestic creditors
External creditors


