
National and Global Islamic Financial Architecture:
Prolems and Possible Solutions for the OIC Member Countries
21
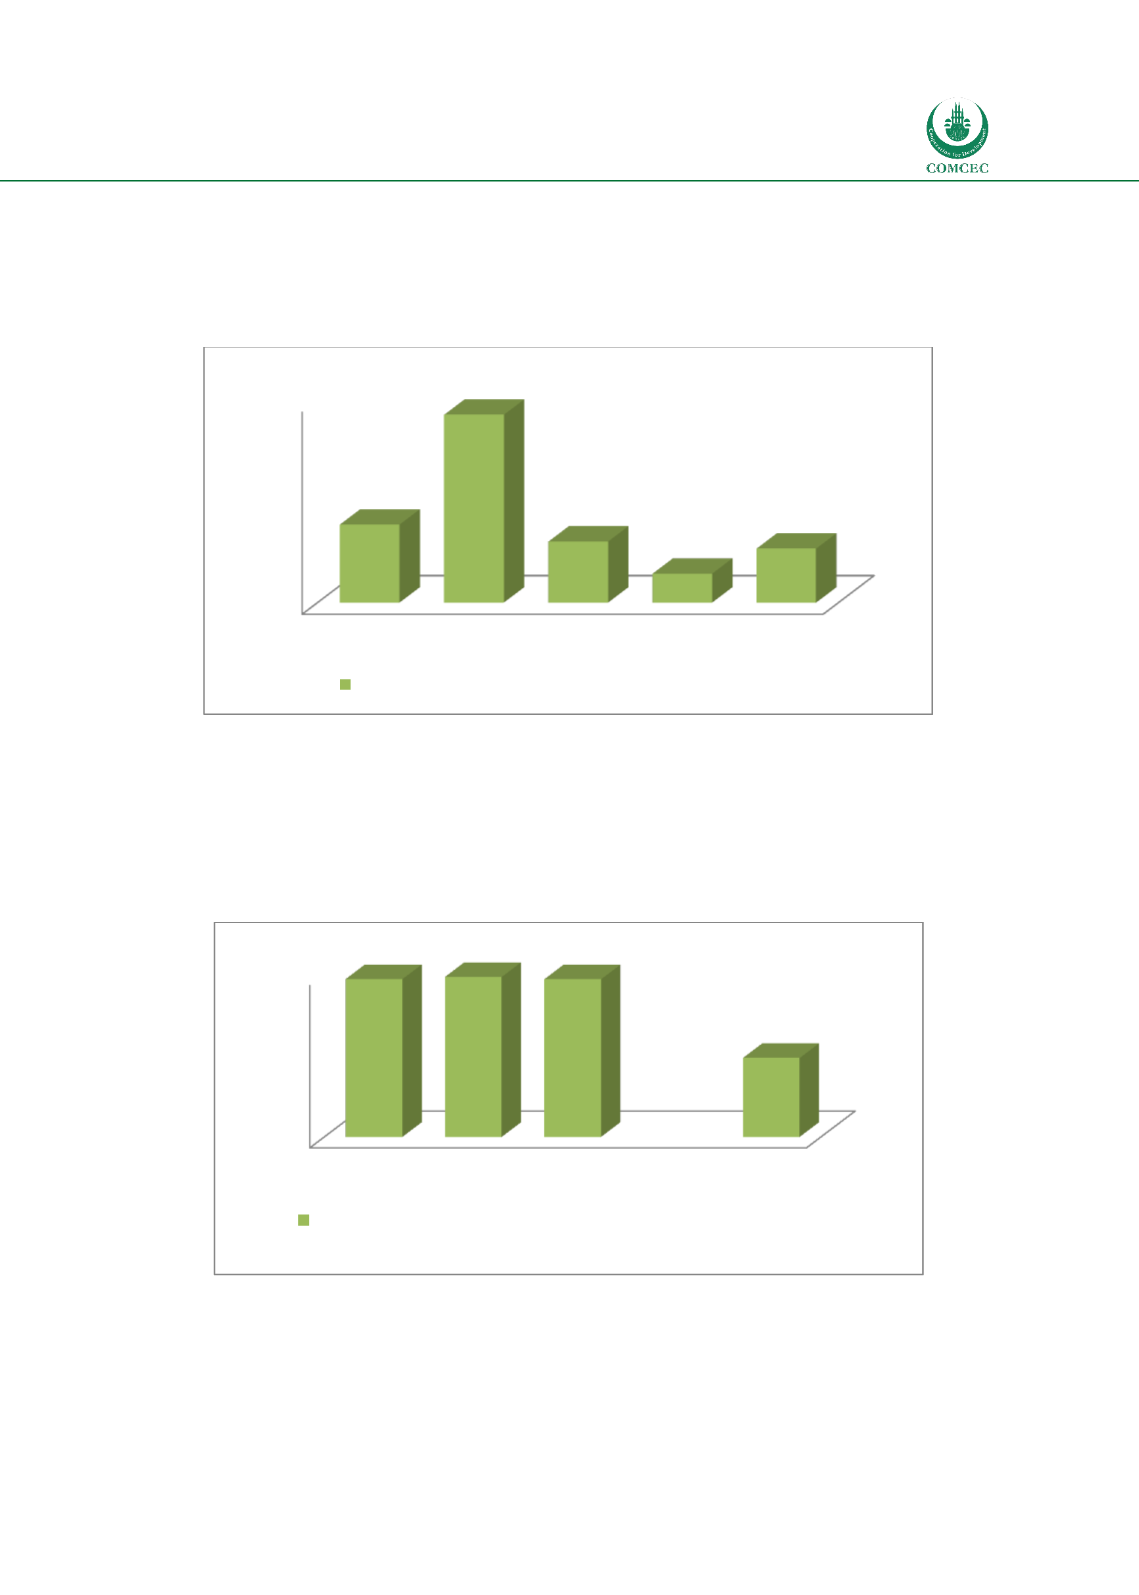
26.8%, which is lower than the world average (38.6%), high income countries (93%), and
middle income countries (30.3%). Though the OIC MCs score better than the average for low
income countries (14.3%), the number indicates that access to financial institutions in OIC MCs
is relatively poor.
Chart
2.8: Financial Institutions-Access
Source: Calculated from World Bank Global Financial Development database
Access to financial markets is estimated by the ratio of market capitalization excluding the top
10 companies to total market capitalization. While no data is available for low income
countries, Chart 2.9 shows that the average access to financial markets for 11 OIC MCs (42.3%)
is lower than that of the average for the world (49.6%), high income countries (19.8%), and
middle income countries (49.6%), indicating a relatively poor access to financial markets.
Chart
2.9: Financial Markets-Access
Source: Calculated from World Bank Global Financial Development database
Efficiency
Efficiency of financial institutions is measured by the spread between lending rate and deposit
interest rate. The average of lending-deposit spread for 30 OIC MCs (7%) is higher than that of
0
20
40
60
80
100
World
High Middle
Low OIC
38,6
93,0
30,3
14,3
26,8
Account at a formal financial institution (% age 15+)
35
40
45
50
World
High Middle
Low OIC
49,6
49,8
49,6
42,3
Market capitalization excluding top 10 companies to total market
capitalization (%)


