
National and Global Islamic Financial Architecture:
Problems and Possible Solutions for the OIC Member Countries
18
Insurance Sector
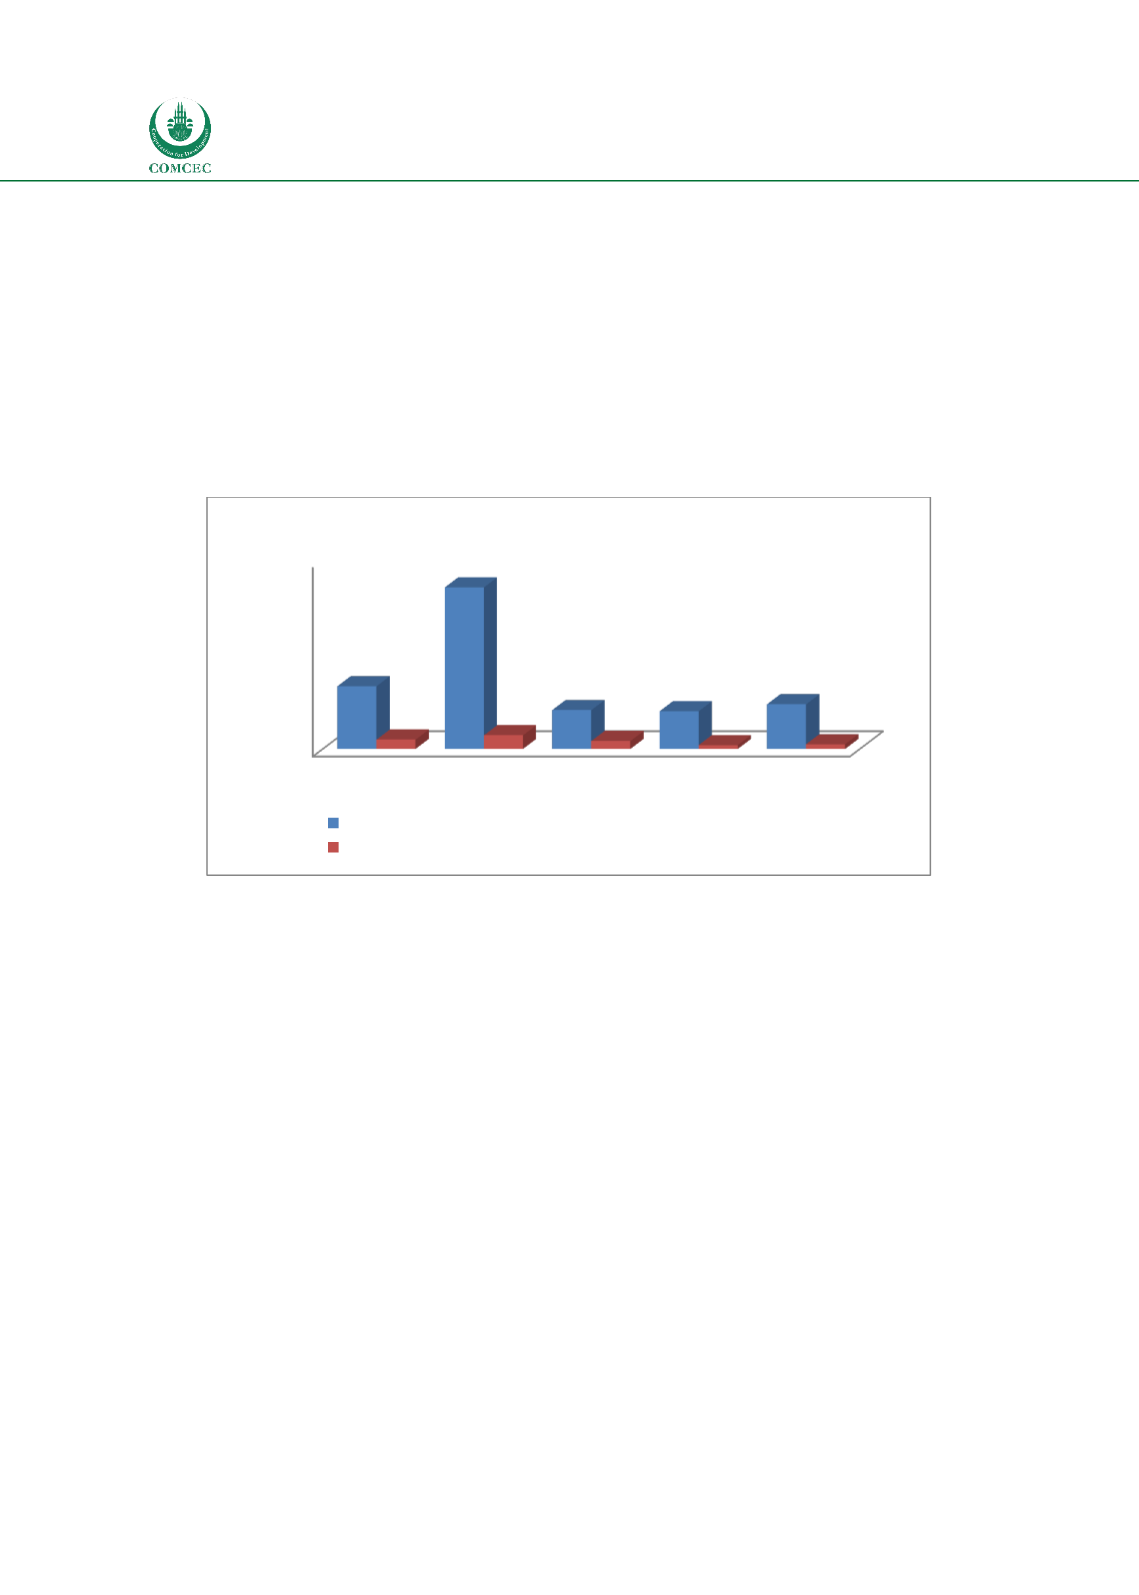
The size of the insurance sector is measured by Insurance company assets as a percentage of
GDP and nonlife insurance premium volumes as a percentage of GDP. Chart 2.4 shows that the
insurance company assets for 13 OIC MCs (5.9% of GDP) is lower than the averages for the
world (8.3%) and high income countries (21.4%), and it is similar to both middle income
(5.2%) and low income countries (5%). The nonlife insurance premium for 44 OIC MCs (0.6%
of GDP) is close to that of low income countries (0.5%) and is lower than the averages for the
world (1.2%), high income (1.8%) and middle income countries (1.1%). Thus, it can be
concluded that the insurance sector for OIC MCs is relatively smaller.
Chart
2.4: Size of the Insurance Sector
Source: Calculated from World Bank Global Financial Development database
Capital Markets
The size of the capital markets is measured by variables representing the size of the debt and
equity markets. The former is measured by the Outstanding Domestic Private Debt Securities
as a percentage of GDP and the later by Stock Market Capitalization as a percentage of GDP.
Chart 2.5 shows that the domestic private debt for four OIC MCs is 16.6% of GDP compared to
28.2% for the world, 44.2% for high income countries, and 12.3% for middle income countries.
Note that there is no information for this variable for low income countries. Furthermore, as
only four countries are used to find the average for OIC MCs, it may not be representative.
Some of the counties not included may not have a domestic private debt securities market and
this information is not captured in the OIC MCs' average. The stock market capitalization as a
percentage of GDP for 23 OIC MCs is 37.1%, which is the second highest after high income
countries (53%). This figure shows that the average size of the stock markets in OIC MCs is
relatively larger than those of the world (30.8%), middle income countries (20.1%), and low
income countries (19.4%).
0
5
10
15
20
25
World
High
Income
Middle
Income
Low
Income
OIC
8,3
21,4
5,2
5,0
5,9
1,2
1,8
1,1
0,5
0,6
Insurance company assets to GDP (%)
Nonlife insurance premium volume to GDP (%)


