
National and Global Islamic Financial Architecture:
Problems and Possible Solutions for the OIC Member Countries
20
Chart
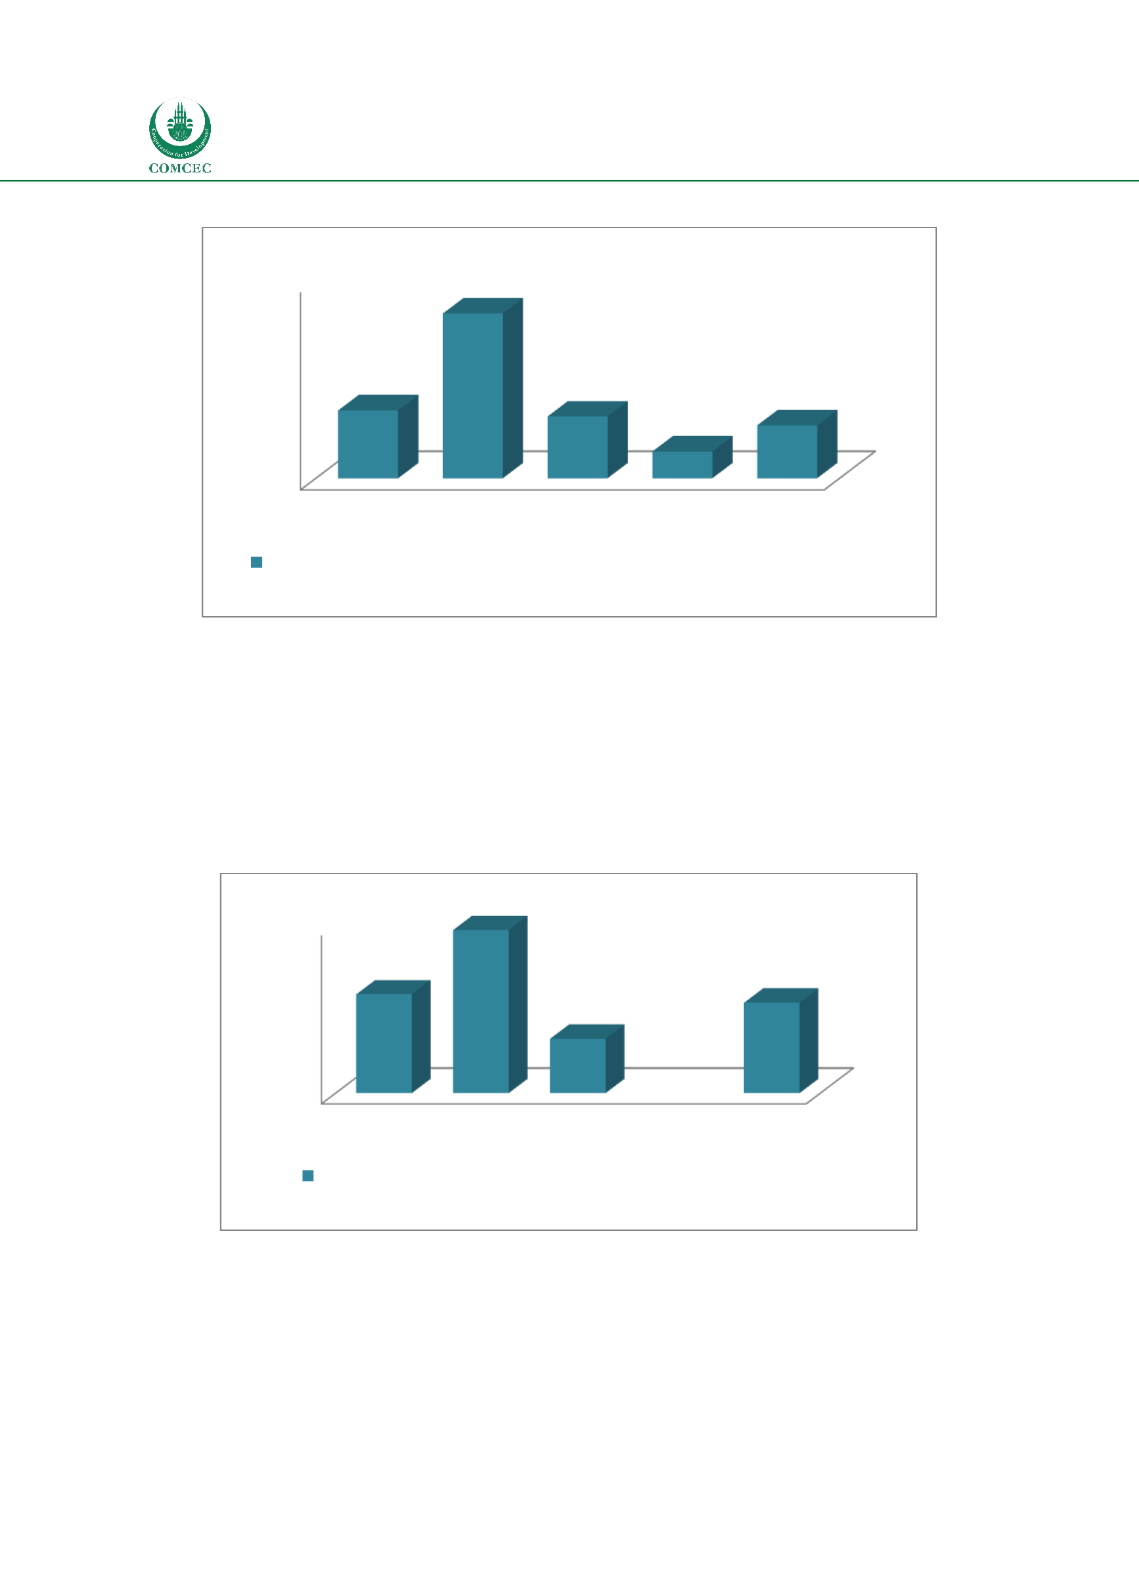
2.6: Financial Institutions-Depth
Source: Calculated from World Bank Global Financial Development database
The depth of financial markets is measured by the sum of total stock market capitalization and
outstanding domestic private debt securities as a percentage of GDP. Chart 2.7 shows that the
average depth of financial markets for OIC MCs is 53.9%, which is lower than the world
average (58.9%) and high income countries (97.3%). The financial markets in OIC MCs appear
to be relatively deeper than the average of middle income countries (32.4%). However, there is
a need for caution in reading this result as the average may not be representative for all
countries with only four countries having data on private debt securities.
Chart
2.7: Financial Markets-Depth
Source: Calculated from World Bank Global Financial Development database
Access
Access to financial institutions is approximated by measuring the percentage of adults (age of
more than 15 years) who have accounts at a formal financial institution such as a bank, credit
union or other financial institution (such as cooperative, microfinance institution or post
office). Chart 2.8 shows that the average access to financial institutions for 49 OIC MCs was
0
20
40
60
80
100
120
World
High
Middle
Low OIC
41,5
100,5
37,7
16,4
32,3
Private credit by deposit money banks and other financial institutions to GDP
(%)
0
20
40
60
80
100
World
High Middle
Low OIC
58,9
97,3
32,4
53,9
Stock market capitalization + Outstanding domestic private debt
securities to GDP (%)


