


 35 / 283

National and Global Islamic Financial Architecture:
Prolems and Possible Solutions for the OIC Member Countries
17
number of countries used to estimate the OIC MCs average is identified when discussing the
results.
2.2.1. Relative Size of the Financial Sector
The size of the financial industry relative to the GDP is a good indicator of the sector’s
development. The relative size of the banking, insurance and capital markets of OIC member
countries and the average for world, high, middle and low income groupings are presented
below.
Banking Sector
Two variables used to assess the size of the banking sector are demand, time and savings
deposits in deposit money banks as a share of GDP (bank deposits as % to GDP) and claims on
the domestic real nonfinancial sector by deposit money banks as a share of GDP (domestic
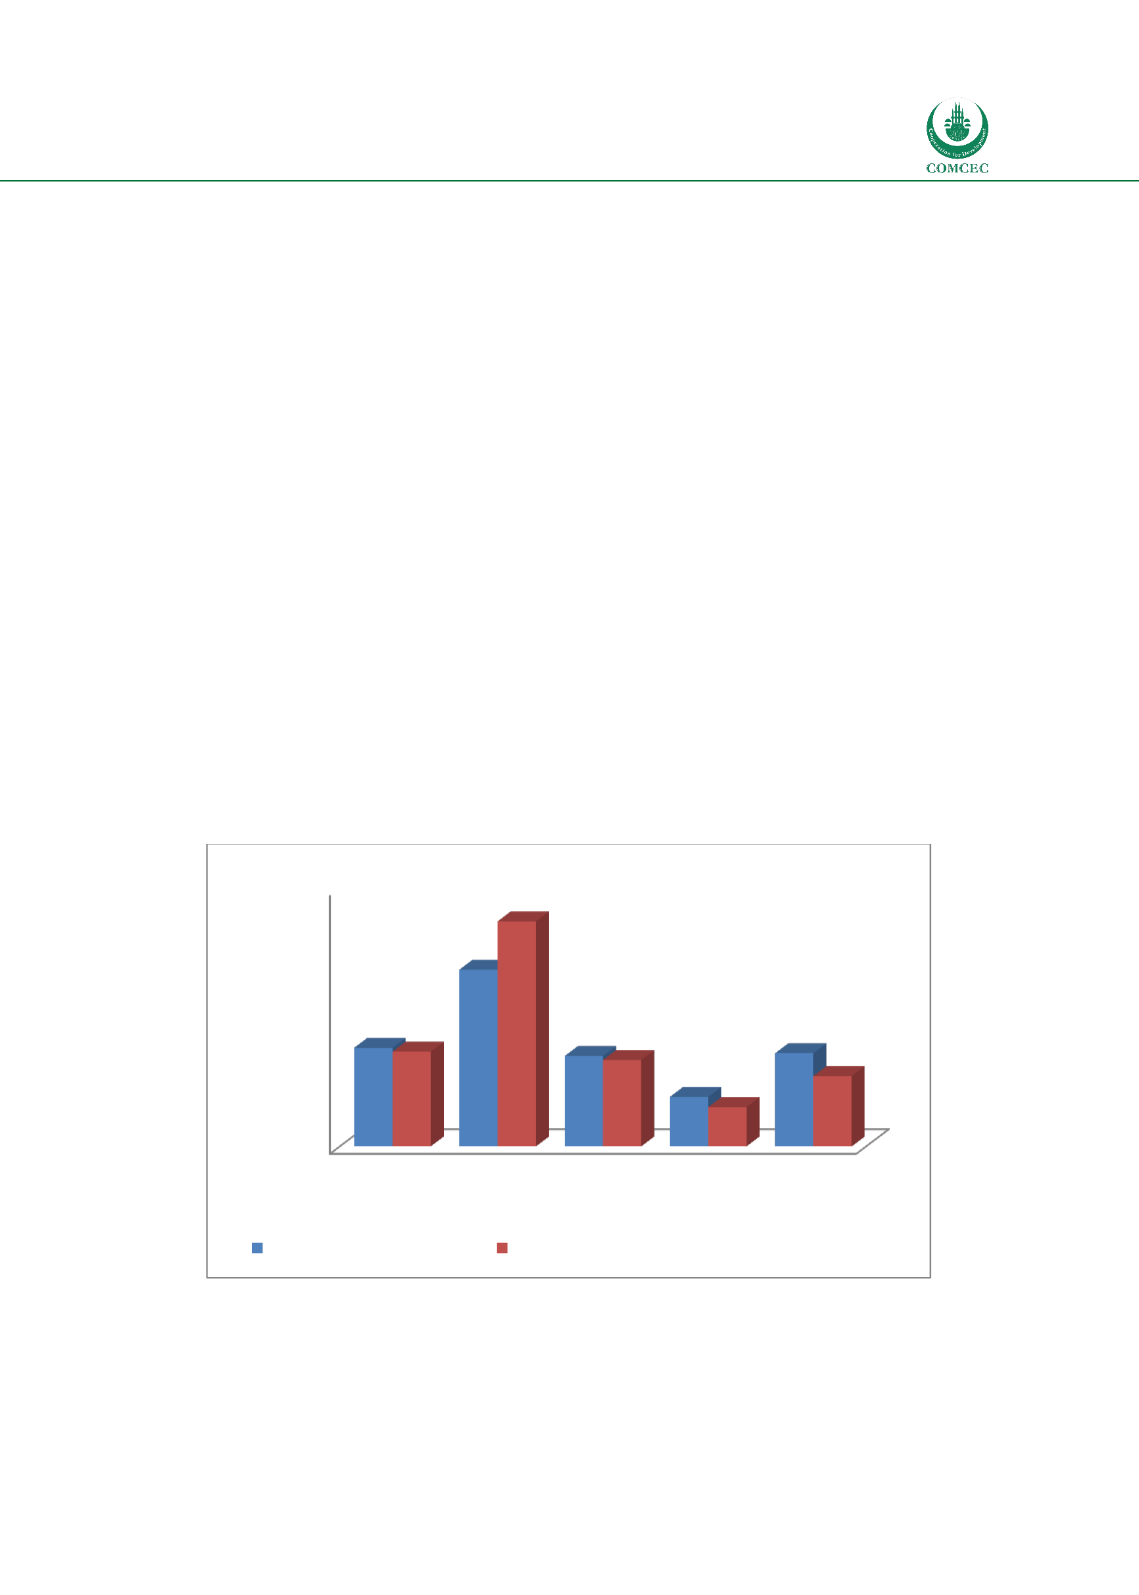
credit to private sector as a % of GDP). Chart 2.3 shows that the average percentage of bank
deposits for 49 OIC MCs is 43.4% of GDP compared to 45.9% for the world. While the average
for OIC MCs is lower than that of high income countries (82.2%), it is significantly higher than
low income countries (23.1%) and is close to that of middle income countries. However, the
average for credit given to the private sector for 48 OIC MCs is 32% which is lower than the
averages for the world (44.1%), high income countries (104.7%), and middle income countries
(40.2%). These numbers indicate that while the status on the liability side of the banking
sector of OIC MCs is similar to the averages of the world and middle income countries, the
average size on the banking assets financing the private sector is lower.
Chart
2.3: Size of the Banking Sector
Source: Calculated from World Bank Global Financial Development database
0
20
40
60
80
100
120
World
High
Income
Middle
Income
Low
Income
OIC
45,9
82,2
42,1
23,1
43,4
44,1
104,7
40,2
18,3
32,8
Percentage
Bank deposits to GDP (%) Domestic credit to private sector (% of GDP)