
National and Global Islamic Financial Architecture:
Problems and Possible Solutions for the OIC Member Countries
22
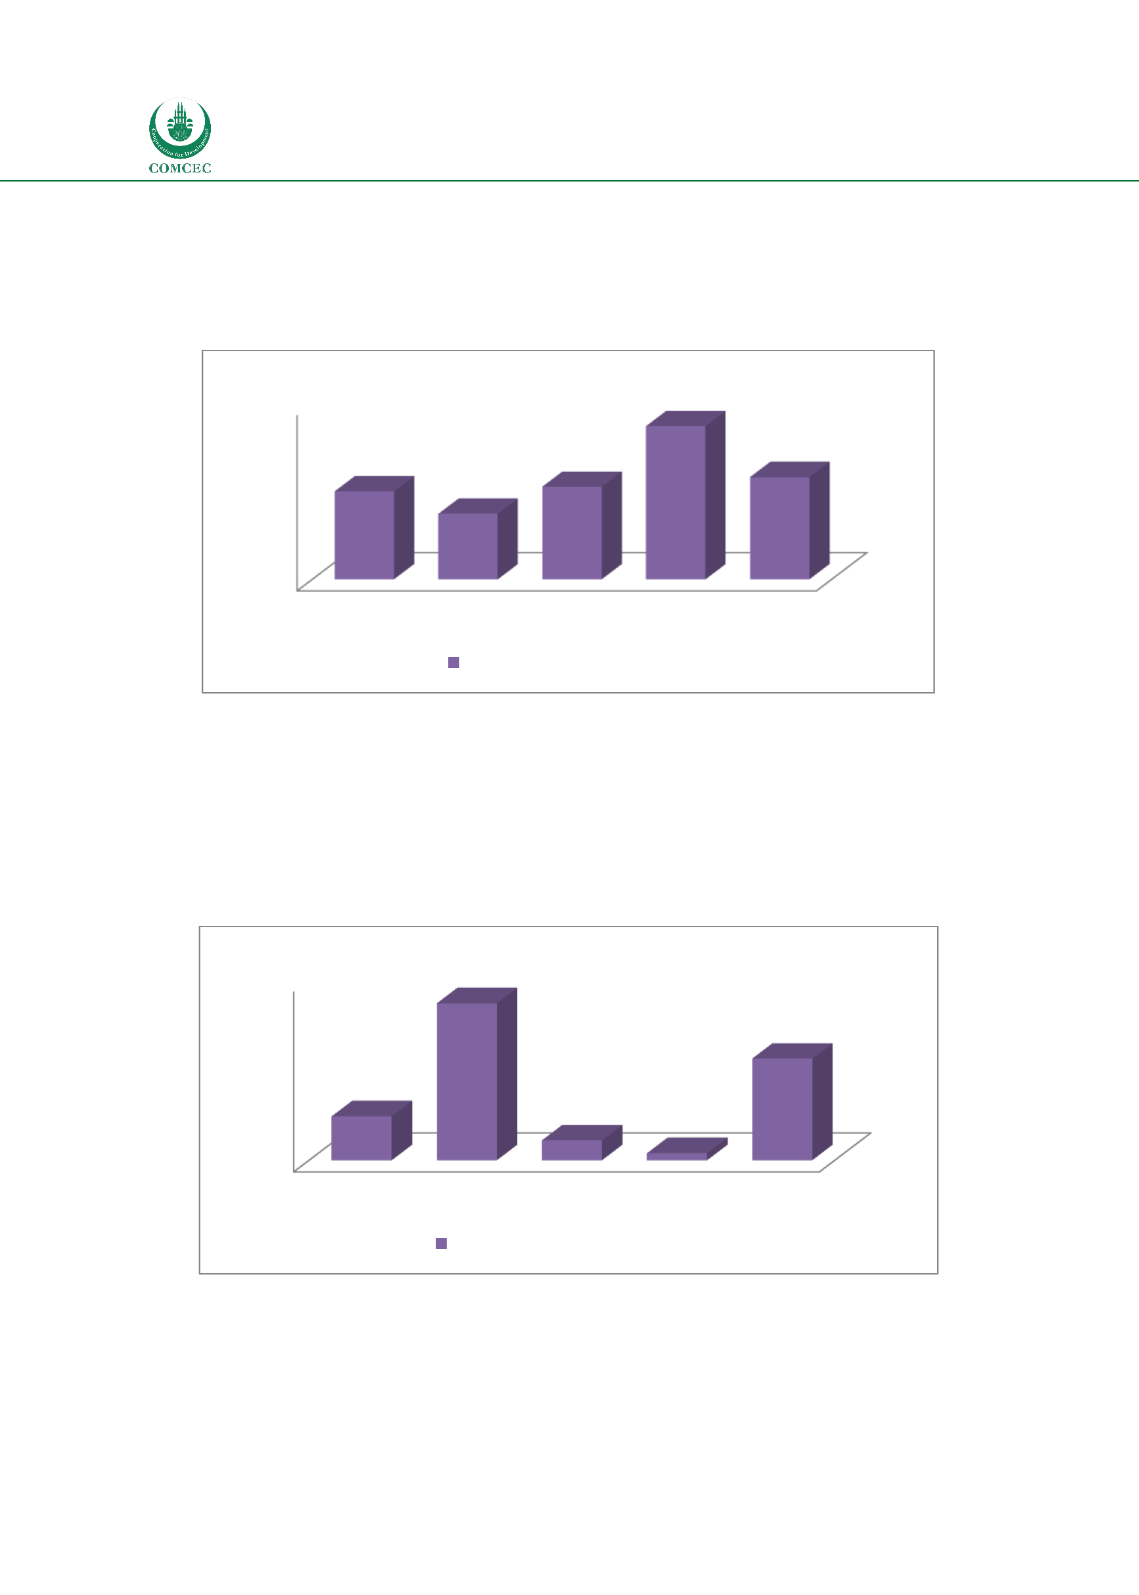
the world (6%), high income countries (4.5%) and middle income countries (6.3%). Although
financial institutions of OIC MCs are more efficient than low income countries (10.5%), the
average for spread shows that they are relatively inefficient compared to that of the other
income groups and the world average.
Chart
2.10: Financial Institutions-Efficiency
Source: Calculated from World Bank Global Financial Development database
Efficiency of financial markets is estimated by the stock market turnover ratio which is
measured by total value of shares traded during the period over the stock market
capitalization. Chart 2.11 shows that the average efficiency of 22 OIC MCs is 28.3%, which is
much higher than the average for the world (12.2%), the middle income countries (5.55) and
low income countries (2%). The results indicate that financial markets in OIC MCs are
relatively more efficient than the world average.
Chart
2.11: Financial Markets-Efficiency
Source: Calculated from World Bank Global Financial Development database
0
2
4
6
8
10
12
World
High
Middle
Low OIC
6,0
4,5
6,3
10,5
7,0
Bank lending-deposit spread
0
10
20
30
40
50
World
High
Middle
Low
OIC
12,2
43,7
5,5
2,0
28,3
Stock market turnover ratio (%)


