
Financial Outlook of the OIC Member Countries 2016
16
in all countries' banking systems, and total regulatory
capital, which includes several specified types of
subordinated debt instruments that need not be repaid if
the funds are required to maintain minimum capital levels
(these comprise tier 2 and tier 3 capital). Total assets
include all nonfinancial and financial assets.
Bank nonperforming loans to
gross loans (%)
GFDD.SI.02 Ratio of defaulting loans (payments of interest and
principal past due by 90 days or more) to total gross loans
(total value of loan portfolio). The loan amount recorded as
nonperforming includes the gross value of the loan as
recorded on the balance sheet, not just the amount that is
overdue.
Source: World Bank (2016b). For more detailed definitions, see CCO (2015, p.61-63).
Rest of the chapter explains the figures in selected measures by financial characterizations.
Measures are aggregated and interpreted on income level groups. Appendix II, Tables 9
through 24 present data on country by year and income groups. For data on specific country,
Appendix II should be referred.
Financial Access
3.1
Financial access, also termed as financial inclusion, is “the degree to which the public can
access financial services” (Cihak et al., 2012:12). Higher financial access characteristic of a
financial system allows economy to utilize more quality projects. This allows financial services
to reach more diverse of firms and individuals. Four measures are covered in financial access
characteristics of financial systems.
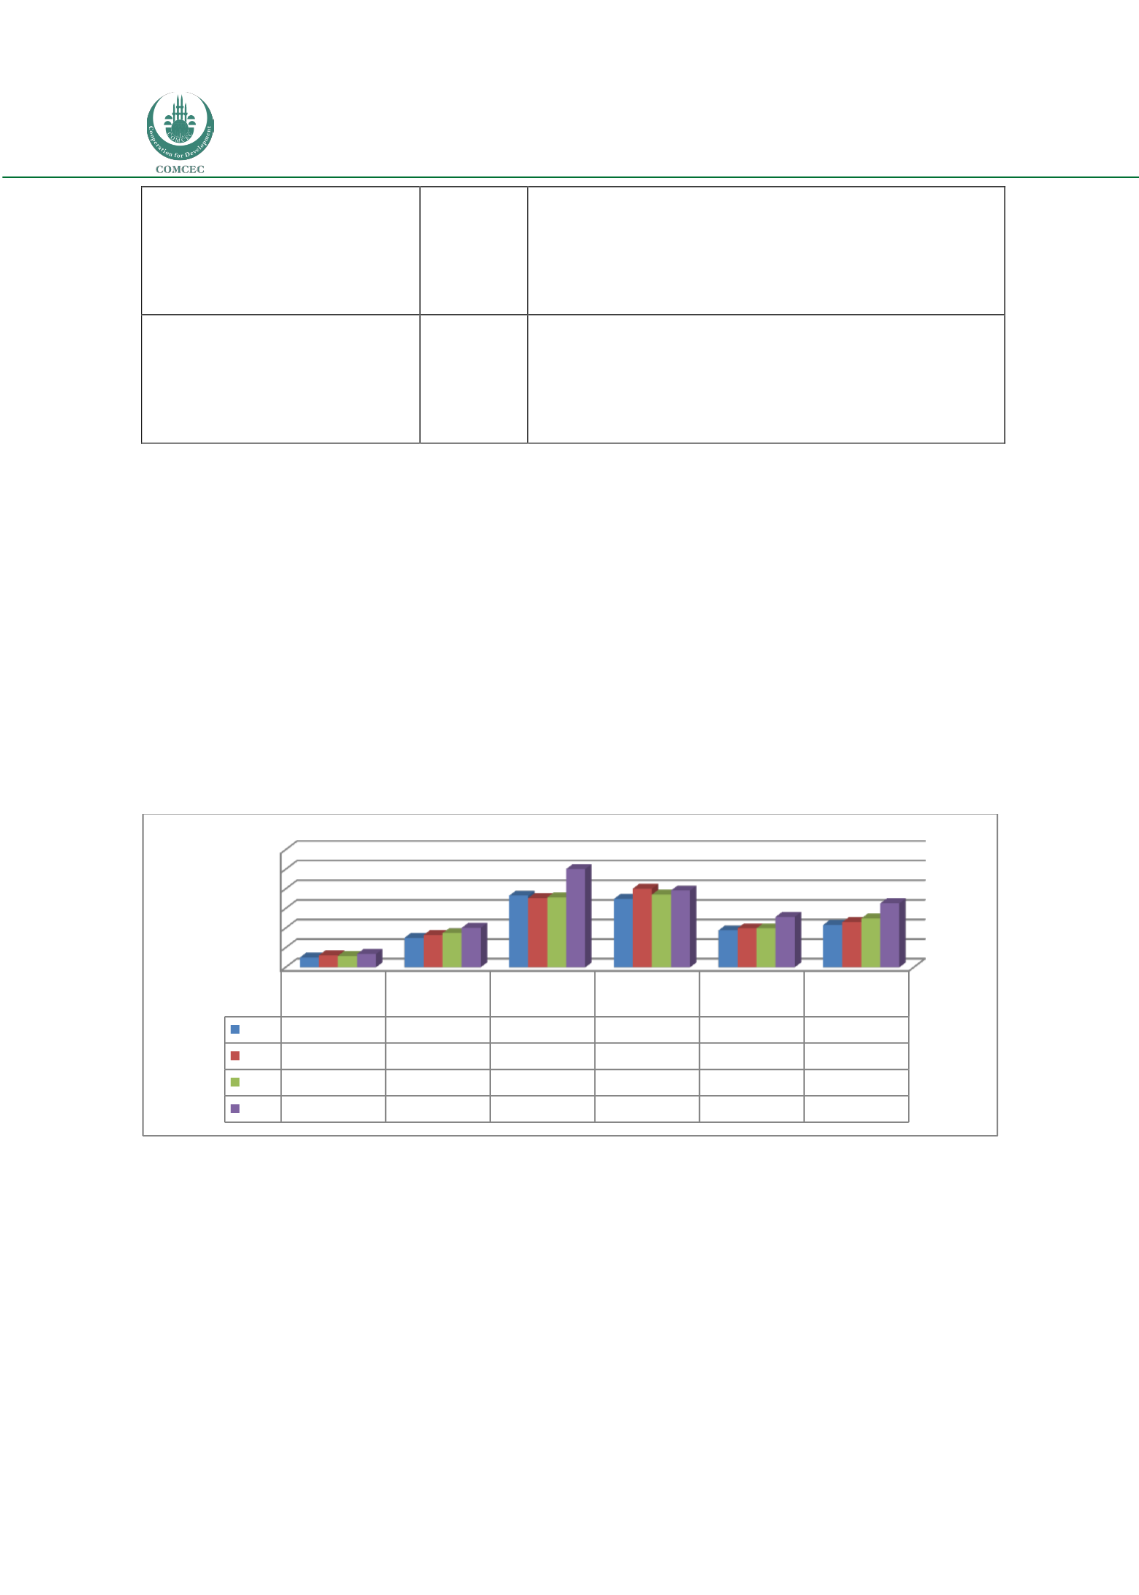
Figure 9: Bank Accounts per 1,000 Adults
Source: COMCEC Coordination Office staff estimations by using Global Financial Development Database, World
Bank (2016b).
Bank accounts per 1,000 adults show how actively individuals use bank services. This measure
identifies access in two respects. One is that individuals are able and willing to use bank
services. The other is that banks are successful to offer bank services to individuals with
affordable prices. Figure 9 shows how this measure evolves over time and among country
groups. From 2011 to 2014, number of bank accounts per 1,000 adults has increased in all OIC
member country groups similar to the world trends. As expected, higher income levels lead
0
200
400
600
800
1000
1200
OIC-LIG
Average
OIC-LMIG
Average
OIC-UMIG
Average
OIC-HIGH
Average
OIC Average
World
2011 100,23
301,56
731,75
697,82
377,58
433,08
2012 122,18
329,27
707,07
803,73
398,80
460,99
2013 117,08
348,51
713,76
742,16
398,98
499,09
2014 136,37
402,58
1003,90
783,74
515,57
653,53


