
Financial Outlook of the OIC Member Countries 2016
12
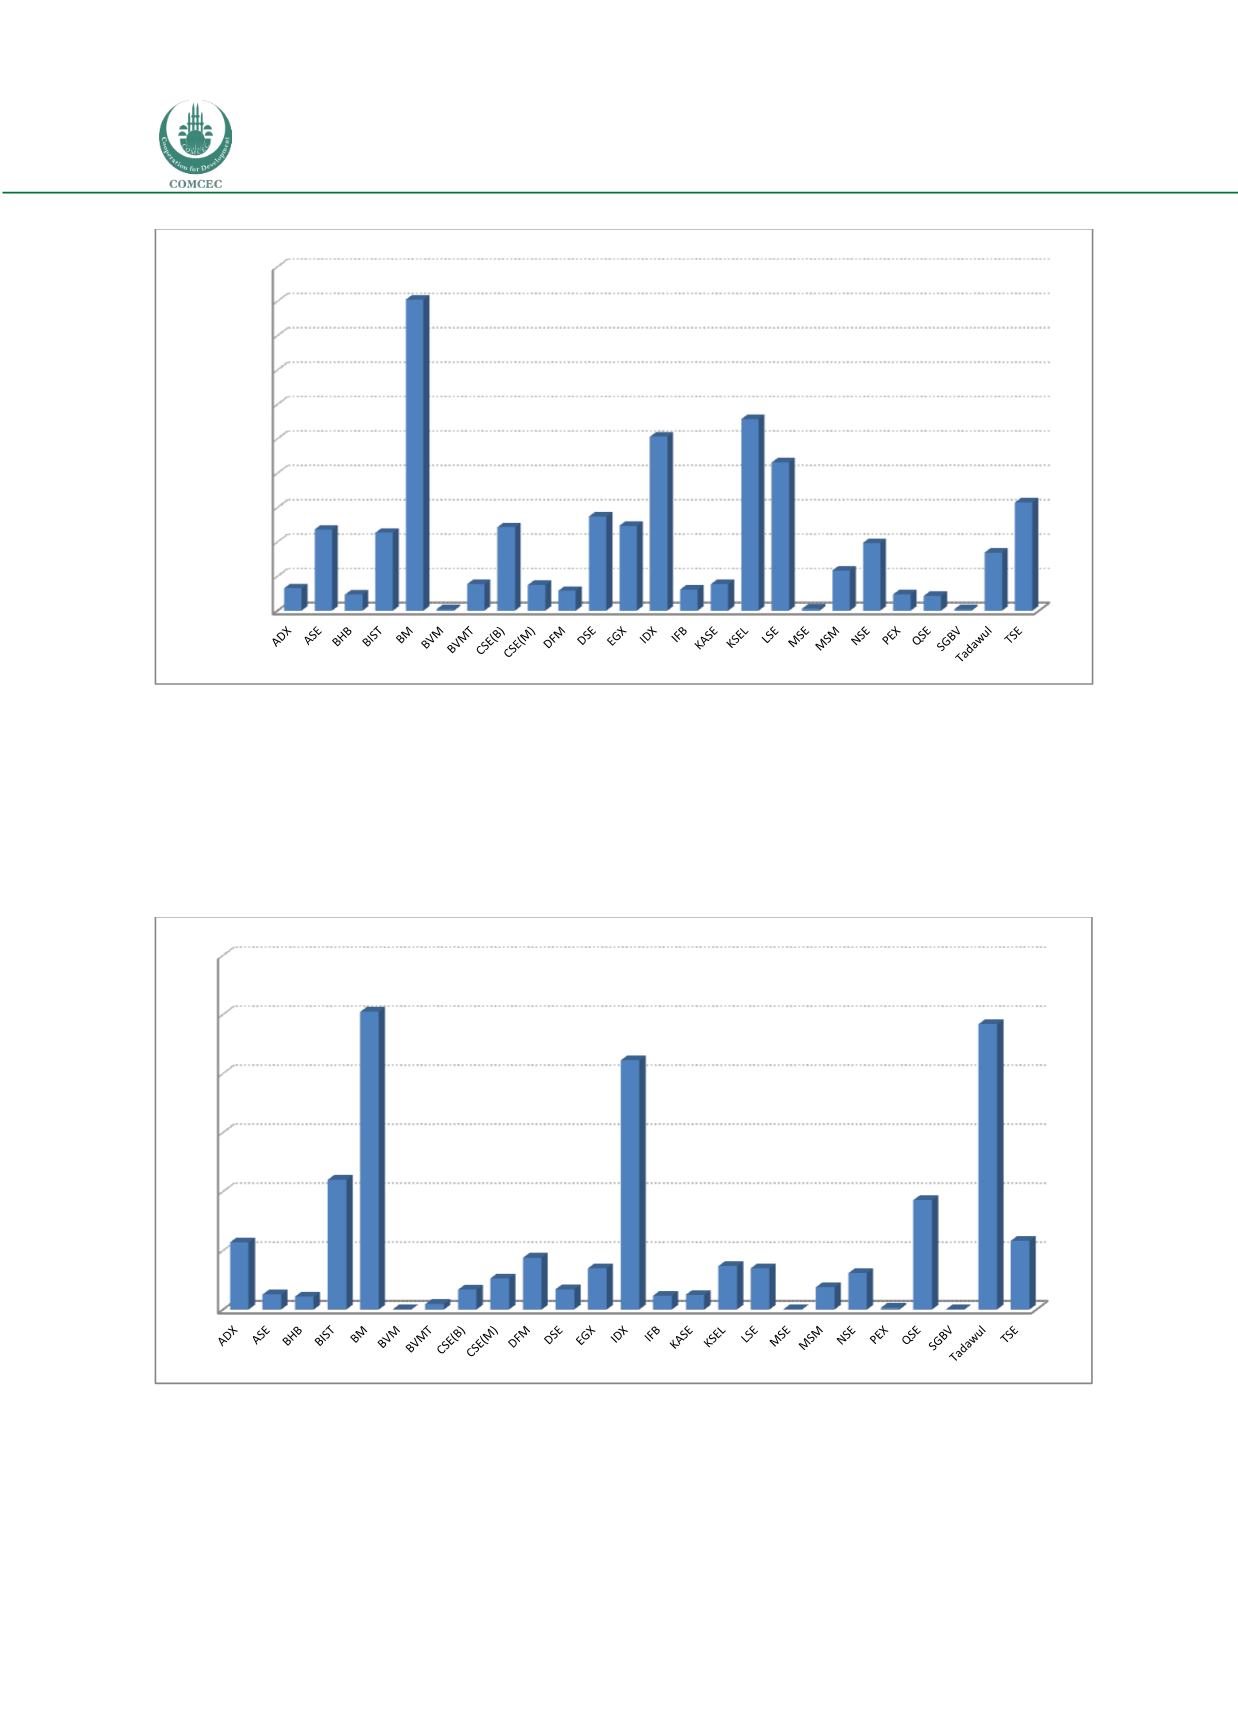
Figure 6: Number of Listed Companies as of 2014
Source: OIC Exchanges (2015)
OIC Exchanges’ market capitalization is 2.7 trillion USD as of 2014. The share of the market
capitalization of the OIC Exchanges to the WFE Exchanges is 4 per cent in 2014 (OIC
Exchanges, 2015). The ratios for the top three (BM, IDX and Tadawul) and top 10 exchanges
(top three plus ADX, BIST, DFM, EGX, KSEL, QSE, and TSE) among OIC Exchanges were 53 per
cent and 85 per cent respectively (Figure 7).
Figure 7: Market Capitalization as of 2014 (billions USD)
Source: OIC Exchanges (2015)
The average ratio of the market capitalizations of the OIC Exchanges to the GDP values of their
respective countries is 37 per cent as of 2014 (Figure 8). The median ratio is 27 per cent (for
BIST). Malaysia has the highest ratio with 154 per cent, followed by Qatar (88 per cent) and
Jordan (71 per cent).
0
100
200
300
400
500
600
700
800
900
1.000
65
236
47
227
905
4
77
243
75 58
274
247
506
62 77
557
431
6
117
197
48 43
4
169
315
Eksen Başlığı
0
100
200
300
400
500
600
114
26 22
220
504
0,5 9,3
33
53
88
34
70
422
24 25
74 70
0,4
38
62
3,2
185
0,2
483
117


