
Financial Outlook of the OIC Member Countries 2016
22
Financial Stability
3.4
Financial stability is complementary to the previous characteristics of access, depth and
efficiency in the sense that it shows how durable or reliable are those characteristics in the
presence of a shock. Hence, financial stability shows the strength of financial systems to
economic or financial shock, such as recession and depreciation in exchange rates. Selected
two measures regarding bank capital shows how much buffer banks have to match a shock and
the selected third measure shows how much banks have already exposed to cost.
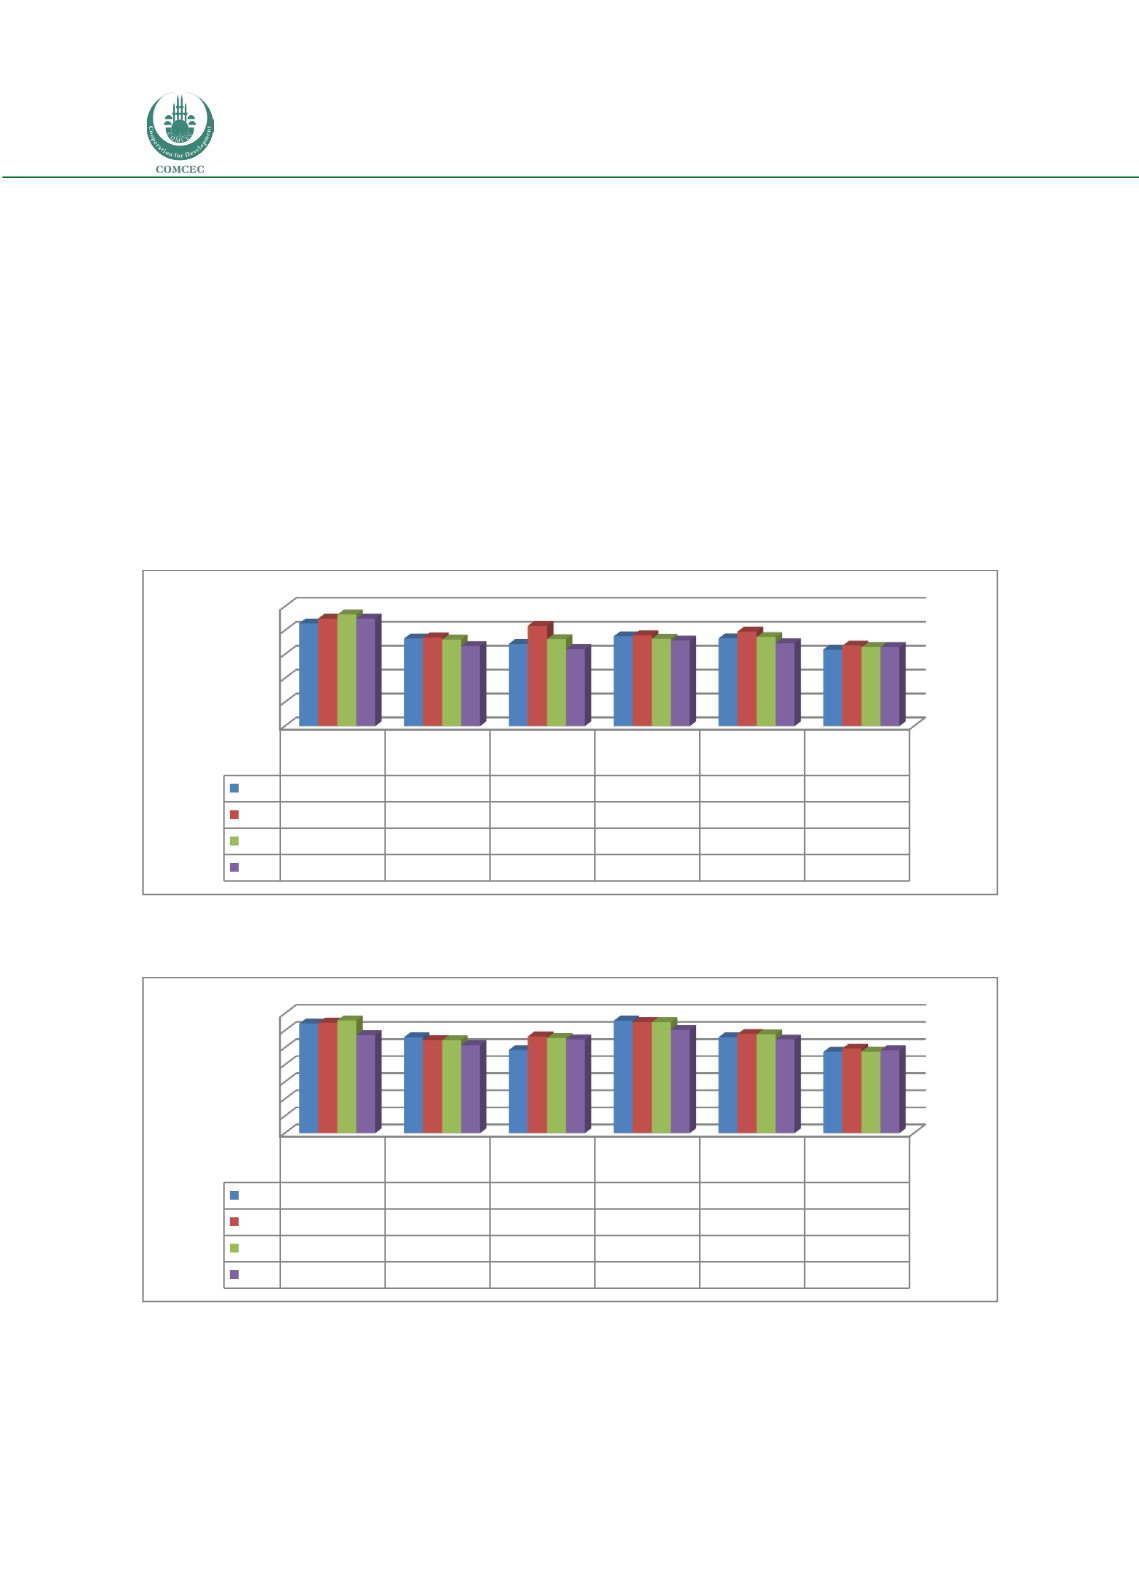
Bank regulatory capital to risk-weighted assets (%) shows the percentage of capital to the
level of assets adjusted to their risks. Hence, some risky assets are regarded more than their
accounting levels. The world average is about 16.5 per cent in 2011-2014. In the same period,
all OIC country groups (except OIC-UMIG in 2014) have higher ratios than the world averages
(Figure 19).
Figure 19: Bank Regulatory Capital to Risk-Weighted Assets (%)
Source: COMCEC Coordination Office staff estimations by using Global Financial Development Database, World
Bank (2016b).
Figure 20: Bank Capital to Total Assets (%)
Source: COMCEC Coordination Office staff estimations by using Global Financial Development Database, World
Bank (2016b).
Bank capital to total assets (%) shows how much capital is used to finance bank activities
including credits, bank’s own buildings etc. Capital includes all capital paid by equity owners,
0
5
10
15
20
25
OIC-LIG
Average
OIC-LMIG
Average
OIC-UMIG
Average
OIC-HIGH
Average
OIC Average
World
2011 21,47
18,30
17,20
18,76
18,32
16,00
2012 22,50
18,52
20,98
18,97
19,76
16,80
2013 23,30
18,11
18,15
18,27
18,60
16,50
2014 22,50
16,76
16,07
17,86
17,34
16,50
0
2
4
6
8
10
12
14
OIC-LIG
Average
OIC-LMIG
Average
OIC-UMIG
Average
OIC-HIGH
Average
OIC Average
World
2011 12,80
11,22
9,73
13,15
11,22
9,50
2012 12,90
10,90
11,32
13,00
11,60
9,90
2013 13,20
10,85
11,15
12,98
11,57
9,55
2014 11,47
10,27
10,94
12,10
10,93
9,70


