
Financial Outlook of the OIC Member Countries 2016
19
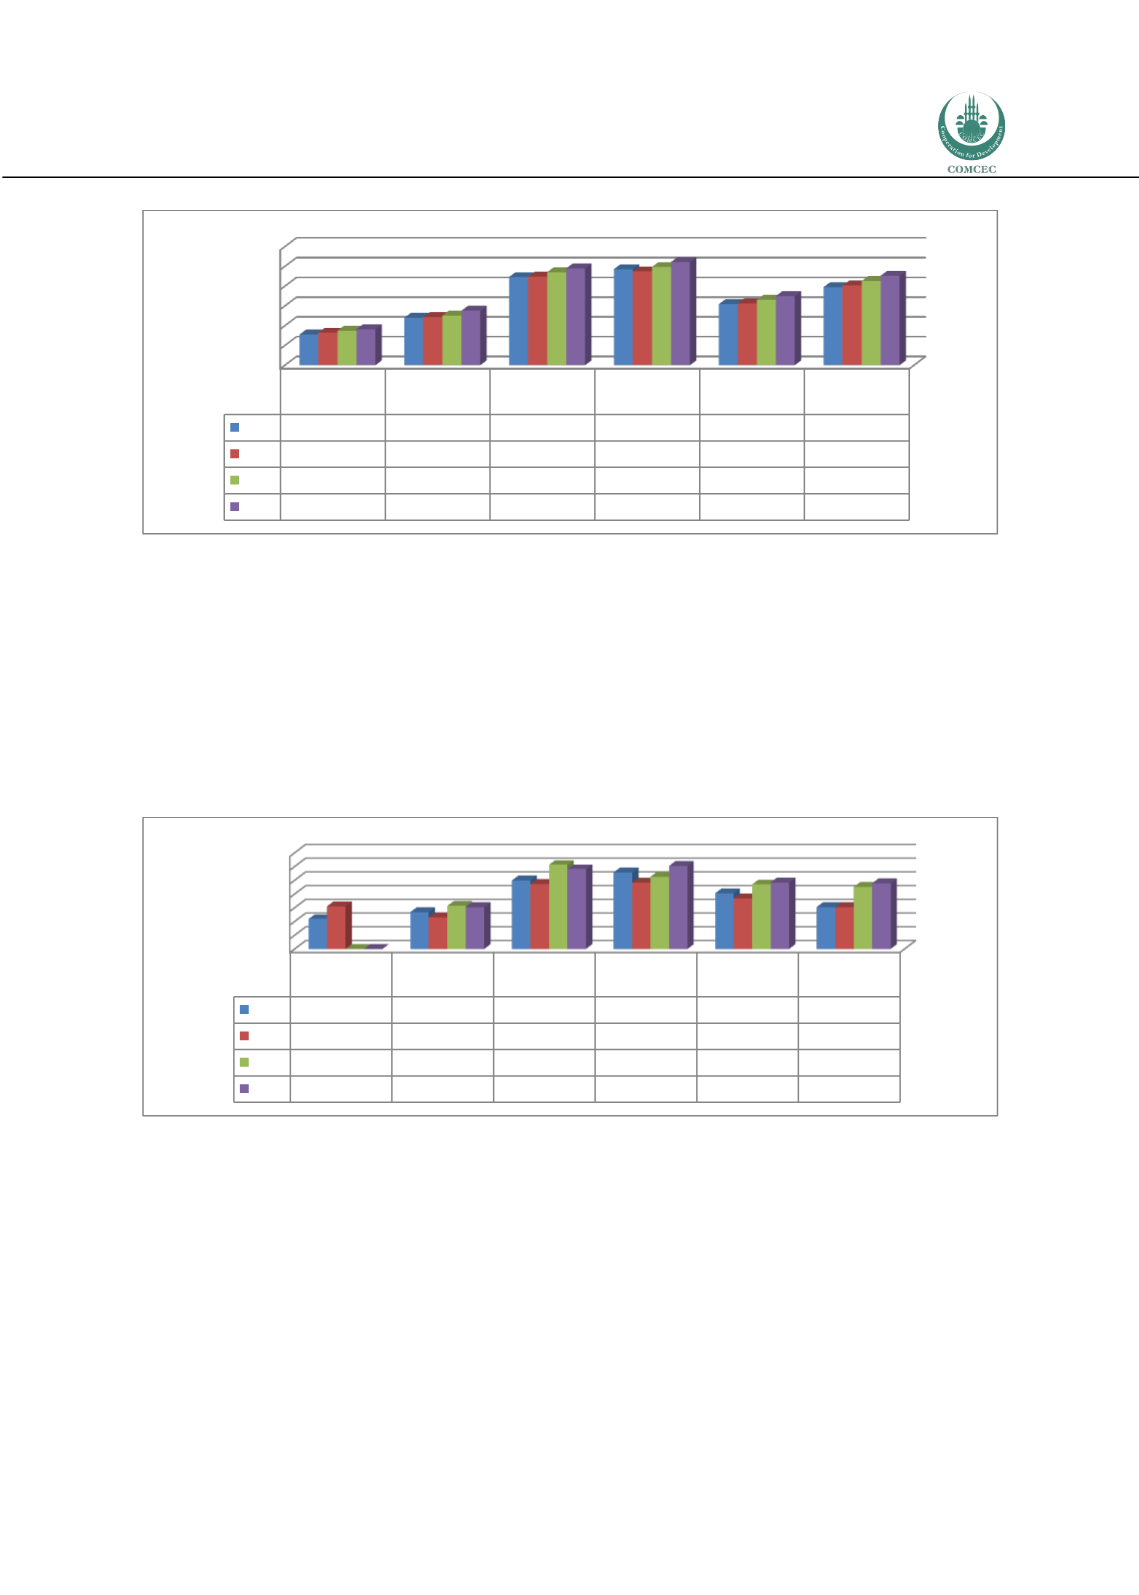
Figure 13: Domestic credit to private sector (% of GDP)
Source: COMCEC Coordination Office staff estimations by using Global Financial Development Database, World
Bank (2016b).
Domestic credit is related to banking activity. To show the extent of capital market activity in
an economy, one measure could be stock market capitalization to GDP (%). This measure
shows the total value of firms, which trades in an organized stock exchange, in per cent of GDP.
Unfortunately, the number of OIC member countries with an organized exchange is limited.
Nevertheless, stock market capitalization to GDP (%) has reached to 30.4, 58.1 and 60.4 per
cent for OIC-LMIG, OIC-UMIG and OIC-HIGH respectively in 2014, compared to 47.8 per cent in
the world (Figure 14).
Figure 14: Stock market capitalization to GDP (%)
Source: COMCEC Coordination Office staff estimations by using Global Financial Development Database, World
Bank (2016b).
Stock market total value traded to GDP (%) shows the value of shares that changed hands with
respect to GDP. Hence, this ratio shows capital market activity in capacity of the given country.
Nominal values may be low but the ratio may be high in line with the capacity of the economy.
The data on this measure shows no activity in OIC-LIG whereas the activity in OIC-HIGH is well
above the world average (Figure 15).
0
10
20
30
40
50
60
OIC-LIG
Average
OIC-LMIG
Average
OIC-UMIG
Average
OIC-HIGH
Average
OIC Average
World
2011 15,40
23,88
44,53
48,51
30,74
39,43
2012 16,42
24,23
44,63
47,44
31,29
40,23
2013 17,41
25,05
46,97
49,64
32,93
42,52
2014 18,18
27,47
48,92
52,15
34,94
45,21
0
10
20
30
40
50
60
70
OIC-LIG
Average
OIC-LMIG
Average
OIC-UMIG
Average
OIC-HIGH
Average
OIC Average
World
2011 21,75
26,77
49,90
55,75
40,55
30,54
2012 31,07
22,97
47,24
48,21
36,70
30,39
2013
0,00
31,31
61,19
52,60
46,95
45,12
2014
0,00
30,37
58,06
60,43
48,42
47,79


