
Financial Outlook of the OIC Member Countries 2016
21
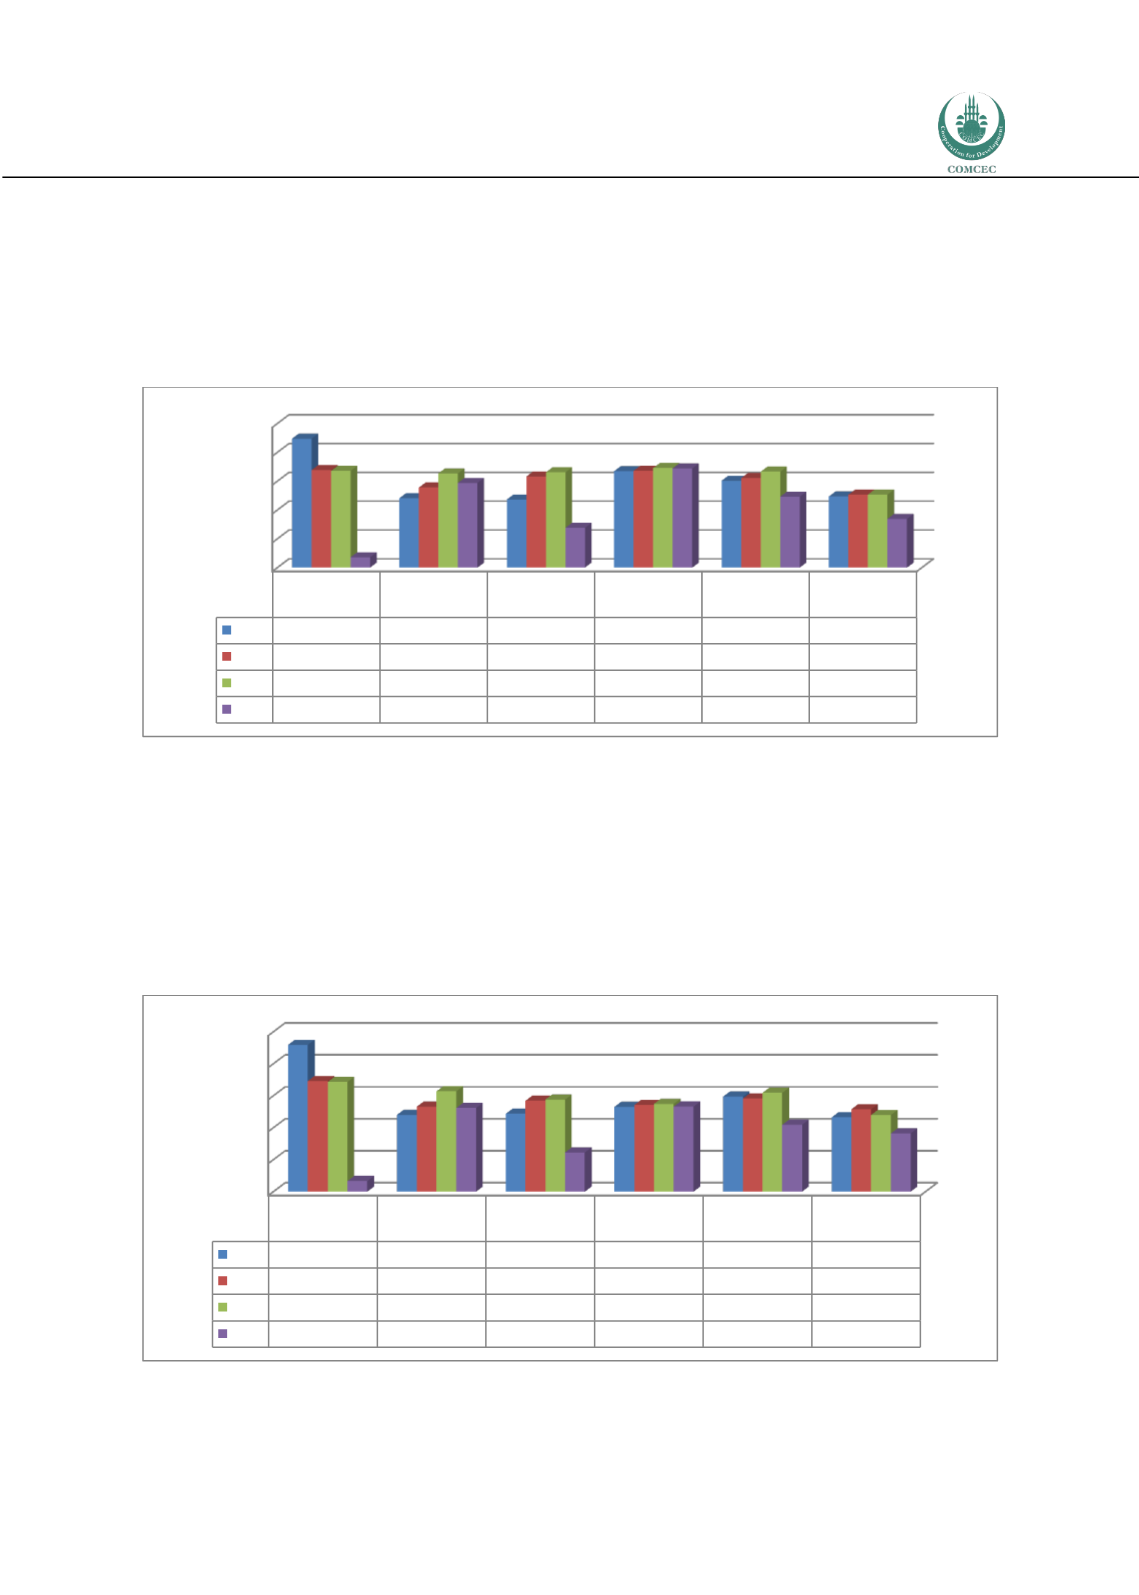
Bank Return on Asset (ROA) (%, after tax) shows the profitability of banks over their average
assets during that year. Hence, over all bank activities that appear in the balance sheet, this
measure shows how high the revenue, stemming from any bank activity regardless of
appearance in the balance sheet, is generated in per cent of assets. ROA drops in 2014 for all
OIC country groups. This profitability ratio has kept its level for OIC-HIGH in 2011-2014
whereas it fluctuated significantly for other OIC country groups (Figure 17).
Figure 17: Bank Return on Asset (ROA) (%, after tax)
Source: COMCEC Coordination Office staff estimations by using Global Financial Development Database, World
Bank (2016b).
Bank Return on Equity (ROE) (%, after tax) shows the bank profitability in terms of the money
invested in this bank. Hence, this measure shows the profitability of bank investors. The world
average in 2011-2014 stayed at around 12 per cent in general and dropped to 9.1 per cent in
2014. This measure for OIC-LIG dropped from 23 per cent in 2011 to 1.7 per cent in 2014. The
averages in 2011-2014 for OIC-LMIG, OIC-UMIG and OIC-HIGH are 13.5, 11.7 and 13.5 per cent
respectively (Figure 18).
Figure 18: Bank Return on Equity (ROE) (%, after tax)
Source: COMCEC Coordination Office staff estimations by using Global Financial Development Database, World
Bank (2016b).
0,00
0,50
1,00
1,50
2,00
2,50
OIC-LIG
Average
OIC-LMIG
Average
OIC-UMIG
Average
OIC-HIGH
Average
OIC Average
World
2011
2,24
1,21
1,18
1,67
1,51
1,24
2012
1,69
1,39
1,58
1,68
1,55
1,27
2013
1,68
1,64
1,65
1,73
1,66
1,27
2014
0,18
1,47
0,69
1,72
1,23
0,85
0
5
10
15
20
25
OIC-LIG
Average
OIC-LMIG
Average
OIC-UMIG
Average
OIC-HIGH
Average
OIC Average
World
2011
22,97
12,02
12,18
13,28
14,86
11,62
2012
17,32
13,28
14,22
13,55
14,55
12,89
2013
17,17
15,70
14,40
13,73
15,47
12,00
2014
1,66
13,09
6,15
13,30
10,46
9,11


