
Improving Public Debt Management
In the OIC Member Countries
49
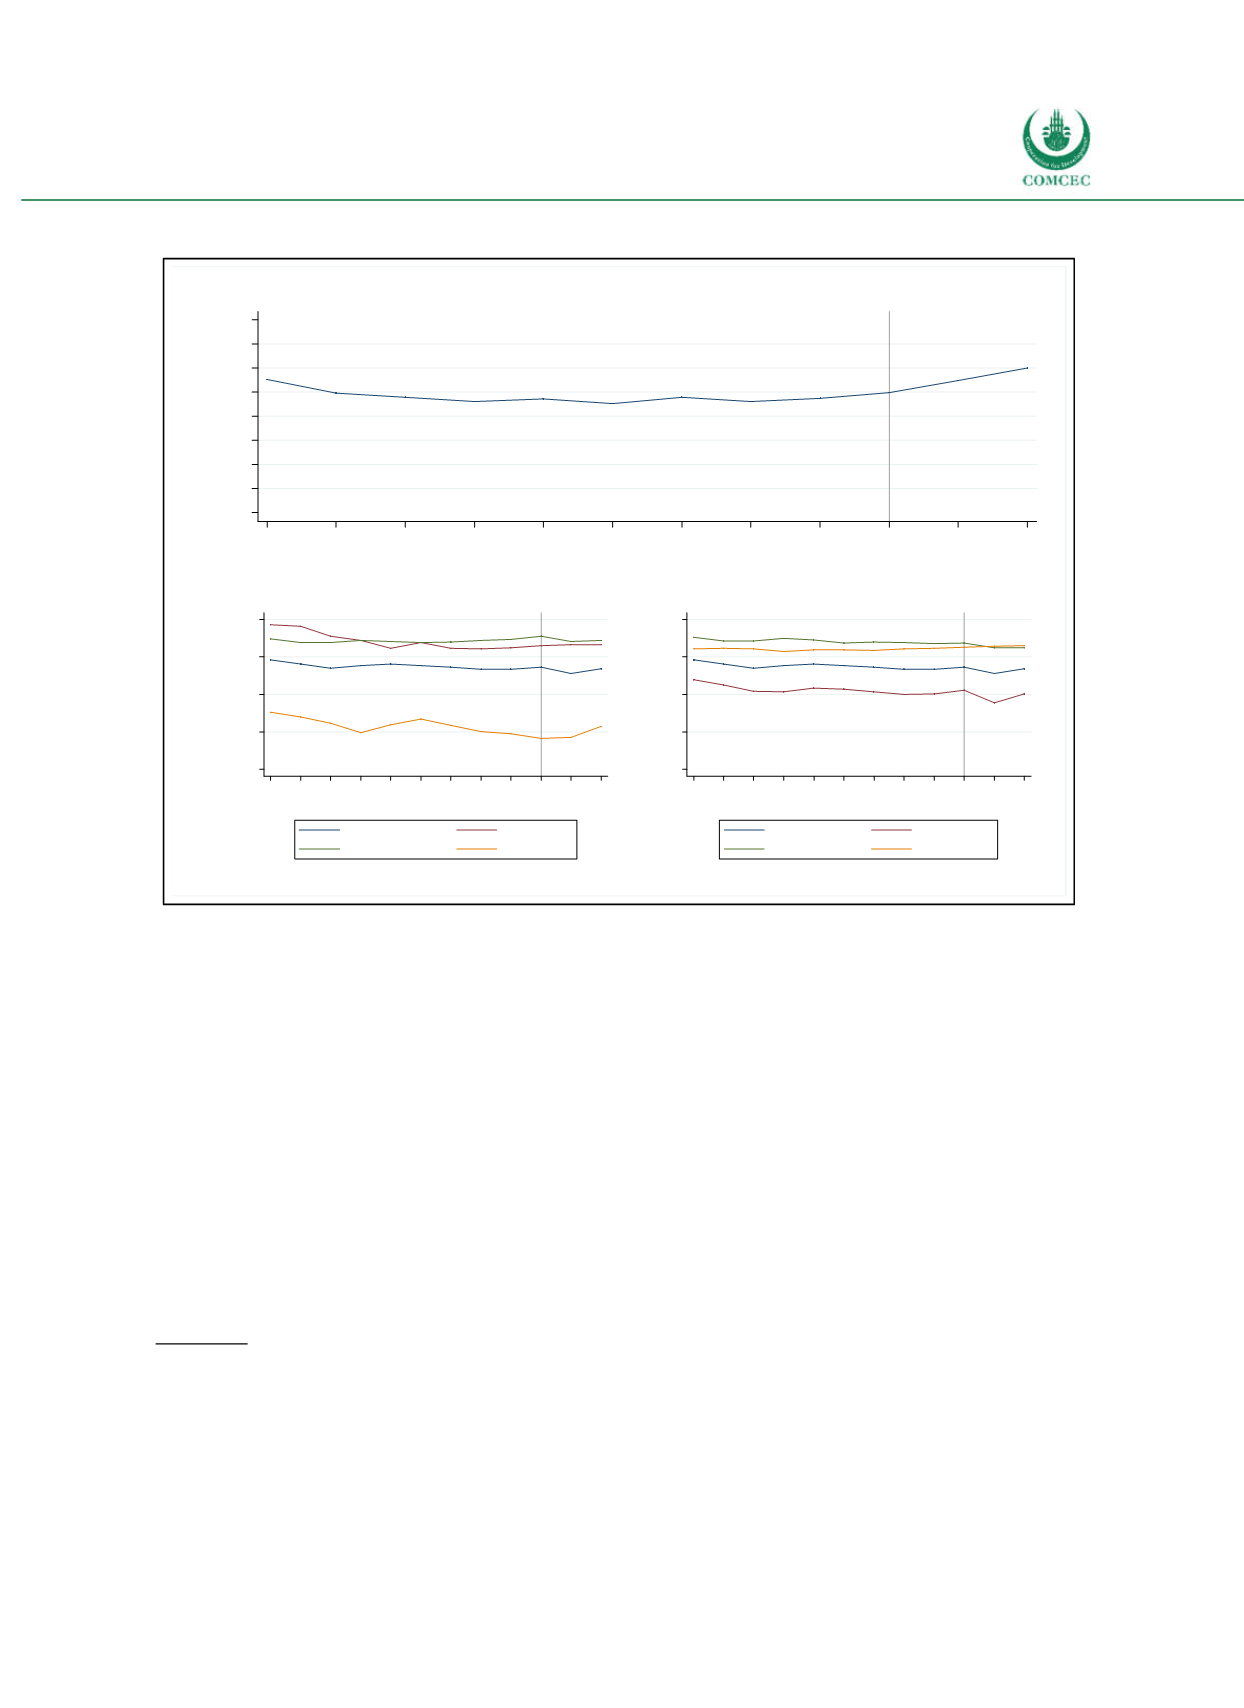
Figure 3-5: Net Debt in OIC Member Countries
Sources: WEO (2016), calculations by the Ifo Institute.
To deal with lower oil revenues, governments have taken various fiscal adjustment measures
including cuts on current and capital spending (see, e.g., Sommer et al. 2016a). Governments
have also increased taxes to tackle fiscal deficits. For example, the GCC countries have reached
a general agreement to introduce a GCCwide valueadded tax (VAT), which could be an
effective instrument to increase fiscal revenues (Alreshan et al. 2015, Sommer et al. 2016b). In
a similar vein, introducing or increasing direct taxes, such as personal or corporate income
taxes, might help reduce fiscal deficits. In addition to the measures mentioned above, most GCC
countries have increased charges or decreased subsidies for fuel, water and electricity.
3.1.3
Debt Structures
The structure of public debt provides important information about the risks entailed in public
indebtedness in the OIC countries. Creditor structures, maturity structures, the currency
composition and interest types of public debt in the OIC member countries are considered.
Creditors
The average share of domestic debt in OIC member states has slightly increased since 2006
and was 42.2% in 2015 (see Figure 36). The share of domestic creditors in OIC countries lies
above the worldwide average. Lowincome countries have a higher share of external creditors
than middleand highincome countries. In highincome countries the share of domestic
creditors has increased since 2008 and amounted to about 77.7% in 2015.
-30
-20
-10
0
10
20
30
40
50
Share of GDP (in %)
2006
2007
2008
2009
2010
2011
2012
2013
2014
2015
2016
2017
Year
Projections
-150
-100
-50
0
50
Share of GDP (in %)
2006 2007 2008 2009 2010 2011 2012 2013 2014 2015 2016 2017
Year
All
Low income
Middle income
High income
Projections
-150
-100
-50
0
50
Share of GDP (in %)
2006 2007 2008 2009 2010 2011 2012 2013 2014 2015 2016 2017
Year
All
Arab Group
Asian Group
African Group
Projections


