
Improving Public Debt Management
In the OIC Member Countries
45
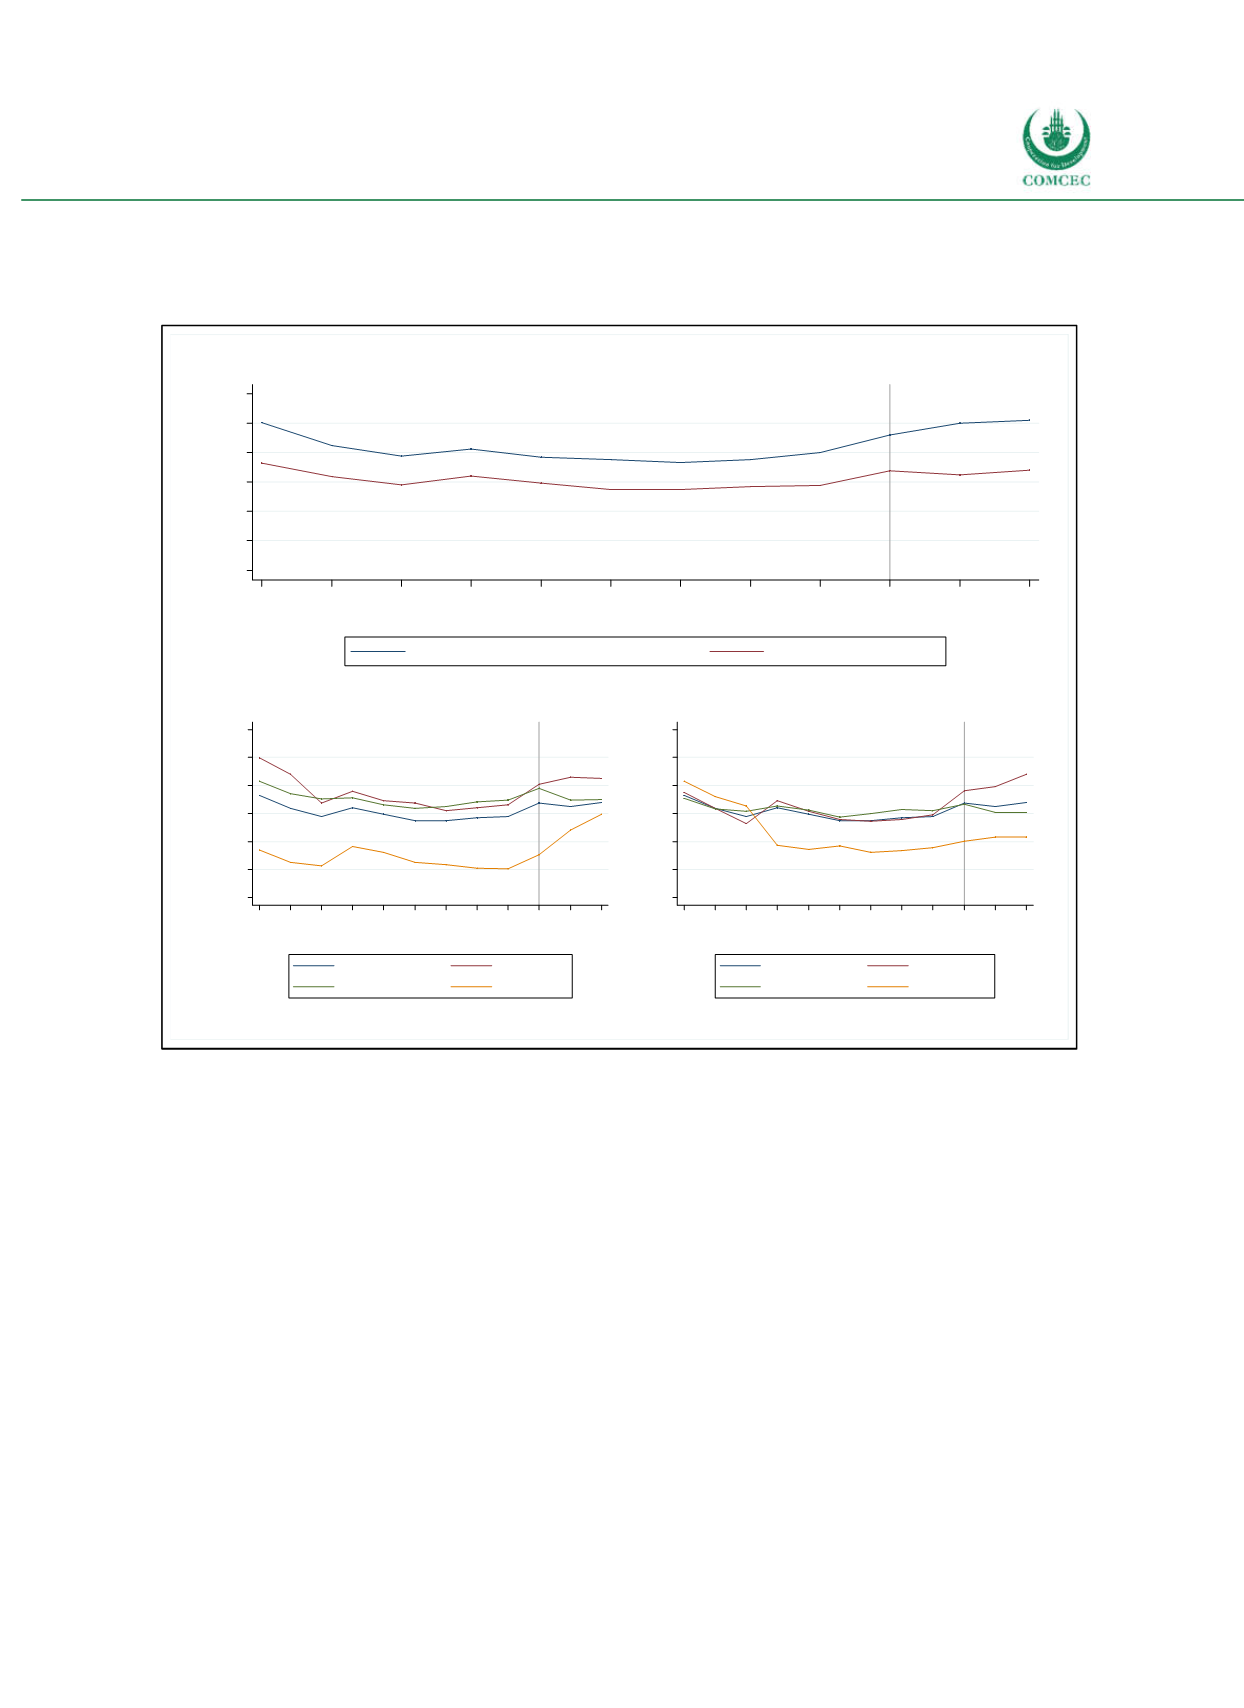
Asian group has been on a relatively stable path. The average debttoGDP ratio in the Arab
group, however, has been strongly increasing since 2014 (see lower right panel of Figure 31).
Figure 3-1: Gross Public Debt in OIC Member Countries
Sources: WEO (2016), calculations by the Ifo Institute.
The amount of outstanding gross public debt as a share of GDP is very heterogeneous among
the OIC countries. Figure 32 shows the public debttoGDP ratios in the individual OIC
countries in 2015. The highest debttoGDP ratios were observed in Lebanon (139.1%), Jordan
(91.7%), Gambia (91.6%) and Egypt (87.7%). The lowest debttoGDP ratios were observed in
Brunei Darussalam (3.1%), Saudi Arabia (5.8%), Afghanistan (6.8%) and Algeria (8.7%).
0
10
20
30
40
50
60
Share of GDP (in %)
2006
2007
2008
2009
2010
2011
2012
2013
2014
2015
2016
2017
Year
Public debt over GDP averaged across countries
OIC public debt over OIC GDP
Projections
0
10
20
30
40
50
60
Share of GDP (in %)
2006 2007 2008 2009 2010 2011 2012 2013 2014 2015 2016 2017
Year
All
Low income
Middle income
High income
Projections
0
10
20
30
40
50
60
Share of GDP (in %)
2006 2007 2008 2009 2010 2011 2012 2013 2014 2015 2016 2017
Year
All
Arab Group
Asian Group
African Group
Projections


