


 40 / 176

Improving Banking Supervisory Mechanisms
In the OIC Member Countries
23
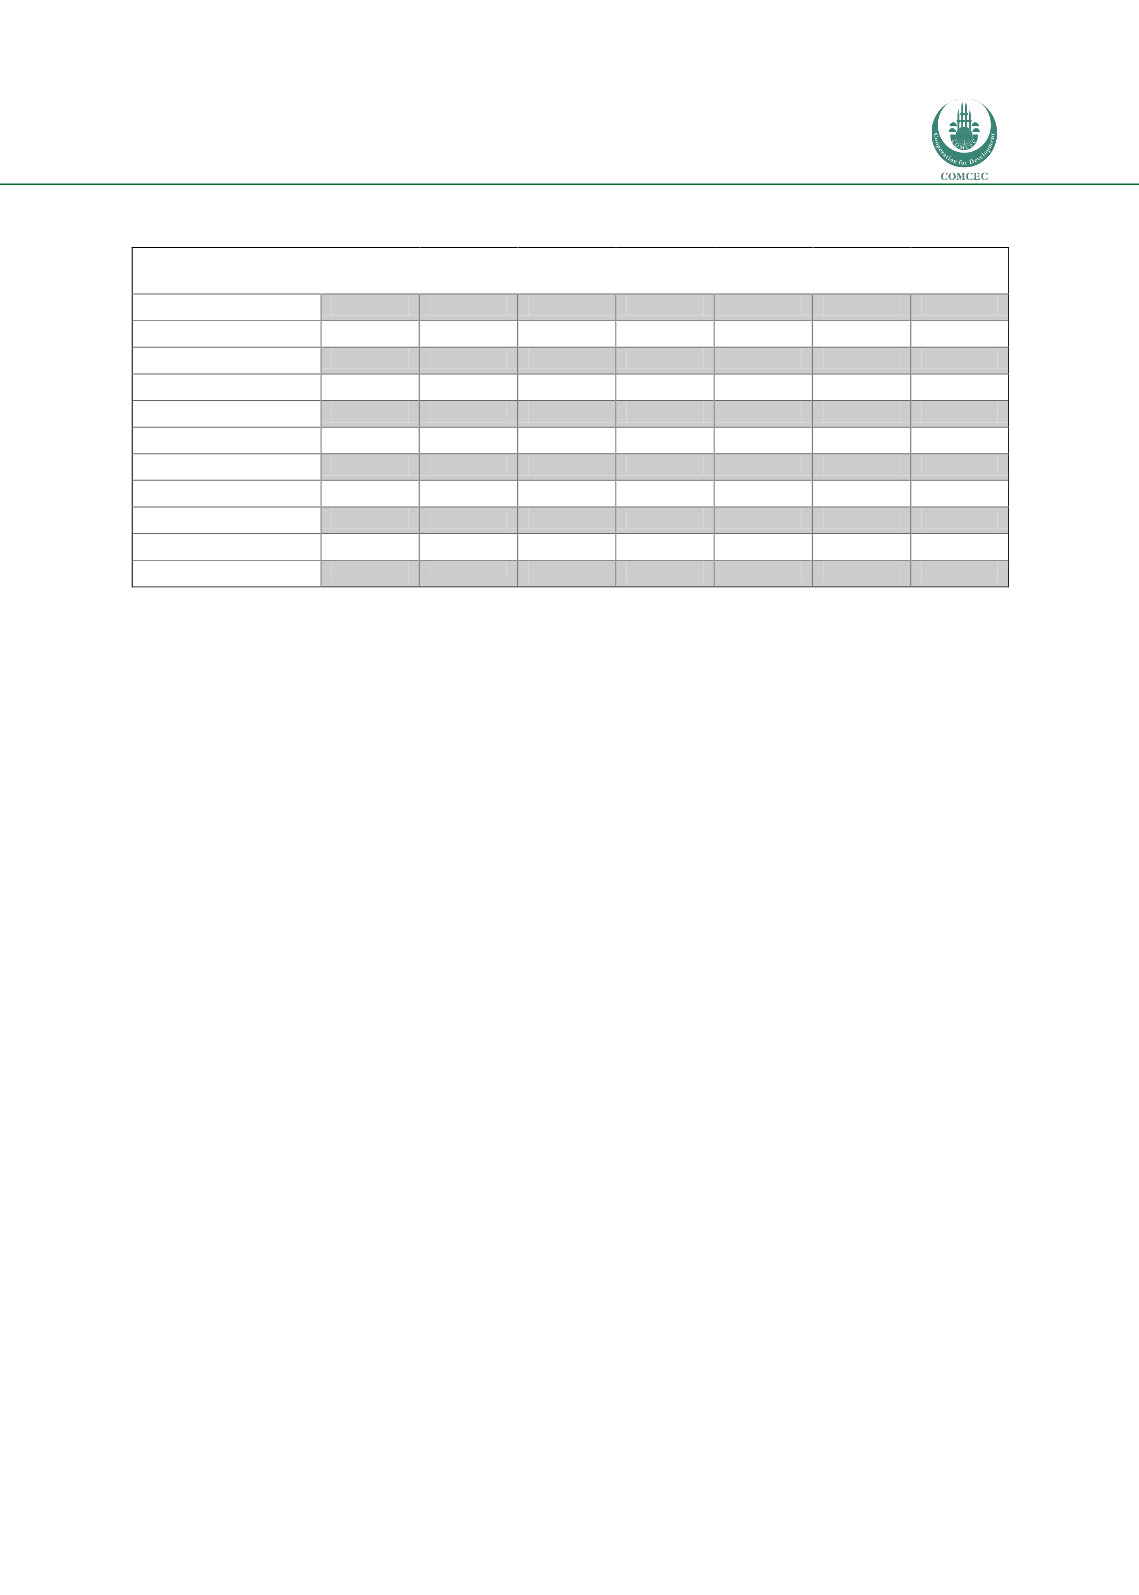
Table 5: Banking versus Non-banking financial sector size in the selected OIC Countries
(percentage)
2007
2008
2009
2010
2011
2012
2013
Turkey
79
76
75
74
72
69
71
Algeria
97
97
93
92
91
92
N/A
Indonesia
49
47
44
40
40
39
45
Kazakhstan
85
85
82
81
82
81
95
Malaysia
74
71
71
69
73
68
68
Nigeria
42
85
71
32
44
53
83
Pakistan
71
70
70
70
74
76
81
Saudi Arabia
58
65
64
62
59
56
57
UAE
65
72
71
68
69
67
67
Eurozone
24
22
23
26
24
25
N/A
USA
19
11
13
13
13
14
14
Source: Bankscope
As can be seen from Table 5, except for Indonesia, banking sector dominates non-banking
financial sector in the selected OIC member states. For most of the member countries, total
banking sector constitutes around 65% of their respective financial sector (2013 average for
the selected OIC member countries). This finding in the selected OIC member states conflicts
with what we observe in the US and Europe. For instance, US has a very big non-bank financial
sector compared to its banking sector, where US banking sector asset size is less than 20% of
the total asset size of its financial sector because of a relatively large stock market brokerage
industry, financial derivative industry, asset management and insurance industry in the US
economy. In addition, there is a significant mortgage related financial industry in the US
economy. A similar observation holds true for the European economy. However, in the selected
OIC countries (which can be generalized for the whole OIC states), non-banking sector
including asset management companies, insurance industry, leasing industry are in a
development stage. Financial development literature supports an even distribution among
banking and non-banking industries; therefore there is an important room for improvement
for the non-financial sector in OIC member states.
In Figure 10, we present the total asset decomposition in the OIC members. For the selected
countries, the dominant asset class seems to be the loans as banks from the selected OIC
member countries do hold 39% of their assets in the form of a loan portfolio. This ratio is
lower than that of both US and EU. However, the securities portfolio of the member countries
is lower than that of both US and EU banking system. Banks in the selected member OIC states
hold only 11% of their assets in their security portfolio. This ratio in EU and US is two to three
times higher. The majority of OIC member states hold a significant amount of other assets, as
specified in Bankscope database, which surfaces as an important issue to be investigated in the
following sections. As can be seen in EU banking system, the amount of loans and securities in
EU banking system is higher than that of US banking system. However, general conclusion,
which can be withdrawn from the analysis, is that securities portfolio of selected OIC member
states is relatively small compared to European banking sector, which might be related to the
fact that trading activities in OIC member countries are relatively limited.