


 45 / 176

Improving Banking Supervisory Mechanisms
In the OIC Member Countries
28
Table 6: Distribution of CAR in Selected OIC Member States (2013)
Turkey Indonesia Kazakhstan Malaysia Nigeria Pakistan S. Arabia U.A.E
Mean
14.23
14.35
15.06
12.16
21.89
12.00
16.35
19.17
St Deviation
2.99
3.18
5.51
1.84
5.02
3.47
4.18
5.28
Range
11.51
12.98
19.80
8.11
17.46
12.72
16.06
16.77
Minimum
9.07
9.15
8.00
9.50
12.60
8.23
11.76
13.90
Maximum
20.58
22.13
27.80
17.61
30.06
20.95
27.82
30.67
Source: Bankscope
In Table 6, we present the statistical distribution Capital Adequacy Ratios (CAR) for the
selected OIC member states. Even though the average CAR is a standard statistics for
measuring the bank capital, the distribution of CAR among banks is also important. For
instance, if one of the banks in the system has a problem in attaining the minimum capital
requirement, then this may cause a systemic effect in the banking system. For this reason we
presented the standard deviation and min-max range of CAR in each country’s banking system.
Average CARs for almost all countries were around 12%. Both the standard deviation and
range of CAR is relatively small among the OIC member states. There are moderate differences
among banks owning minimum and maximum CAR levels. We can see that there is only one
bank in the whole banking that has a CAR close to 8%. Standard deviation for each OIC
member states is around 3% which is quite tolerable considering the averages are around
12%. As a conclusion, selected member states not only obtain a high average CAR but also the
capital adequacy distribution among banks is also very tight. This is a positive aspect for the
supervision since a weakly capitalized institution might cause a systemic banking risk.
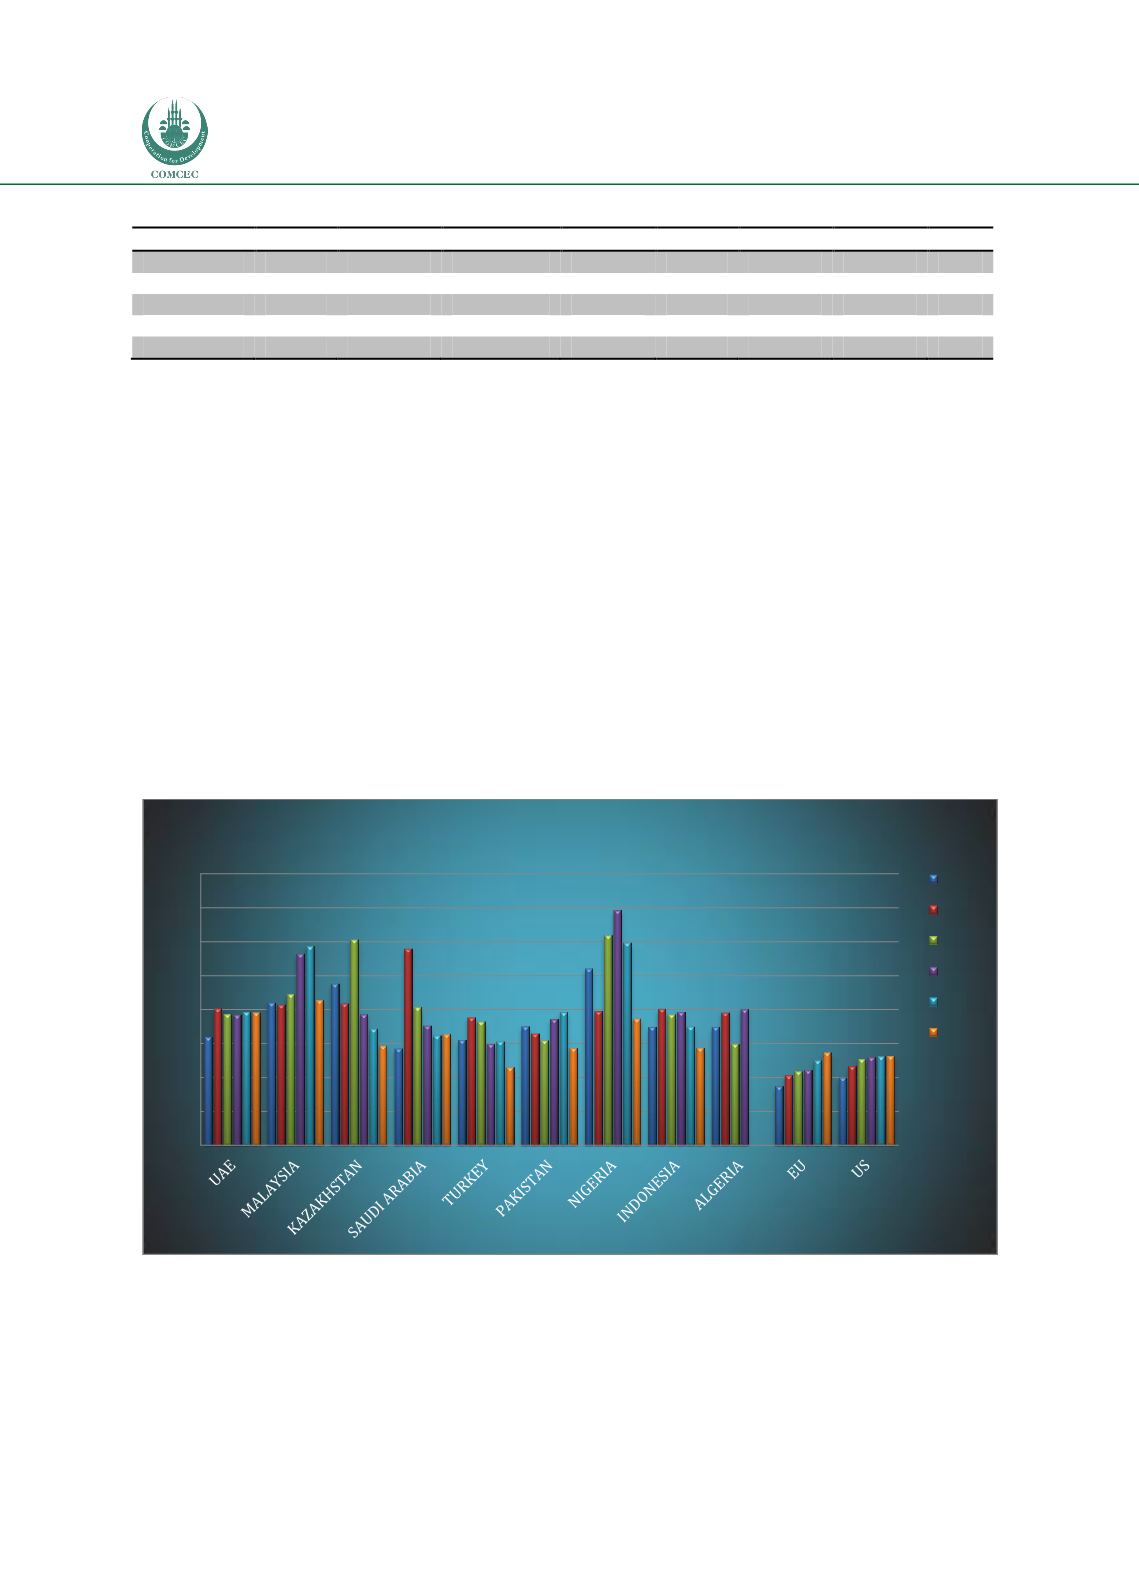
Figure 19: Tier-1 Capital Ratio
Source: Bankscope
Tier 1 capital is also another critical indicator for the quality of bank capital, which is the core
measure of a bank's financial strength for the regulators. New BASEL III requirements are very
demanding for banks to hold an important part of their capital in the form of Tier 1 capital. In
Figure 19, we observe that almost all OIC countries do hold an important portion of their
capital in the form of Tier 1 capital. This is a positive condition for the OIC member countries
0,0
5,0
10,0
15,0
20,0
25,0
30,0
35,0
40,0
Tier-1 Capital Ratio
2008
2009
2010
2011
2012
2013