


 38 / 176

Improving Banking Supervisory Mechanisms
In the OIC Member Countries
21
In addition, the numbers of banking branches in OIC member states are much lesser than that
of developed countries which indicates a relatively lower banking population in OIC member
states compared to US and Europe. However, this may also imply that there is a room for
banking sector development and financial inclusion in the OIC member states.
3.1.2.2 Banking Sector Asset and Deposit Concentration
Figure 8: Bank Concentration (percentage)
Source: Bankscope
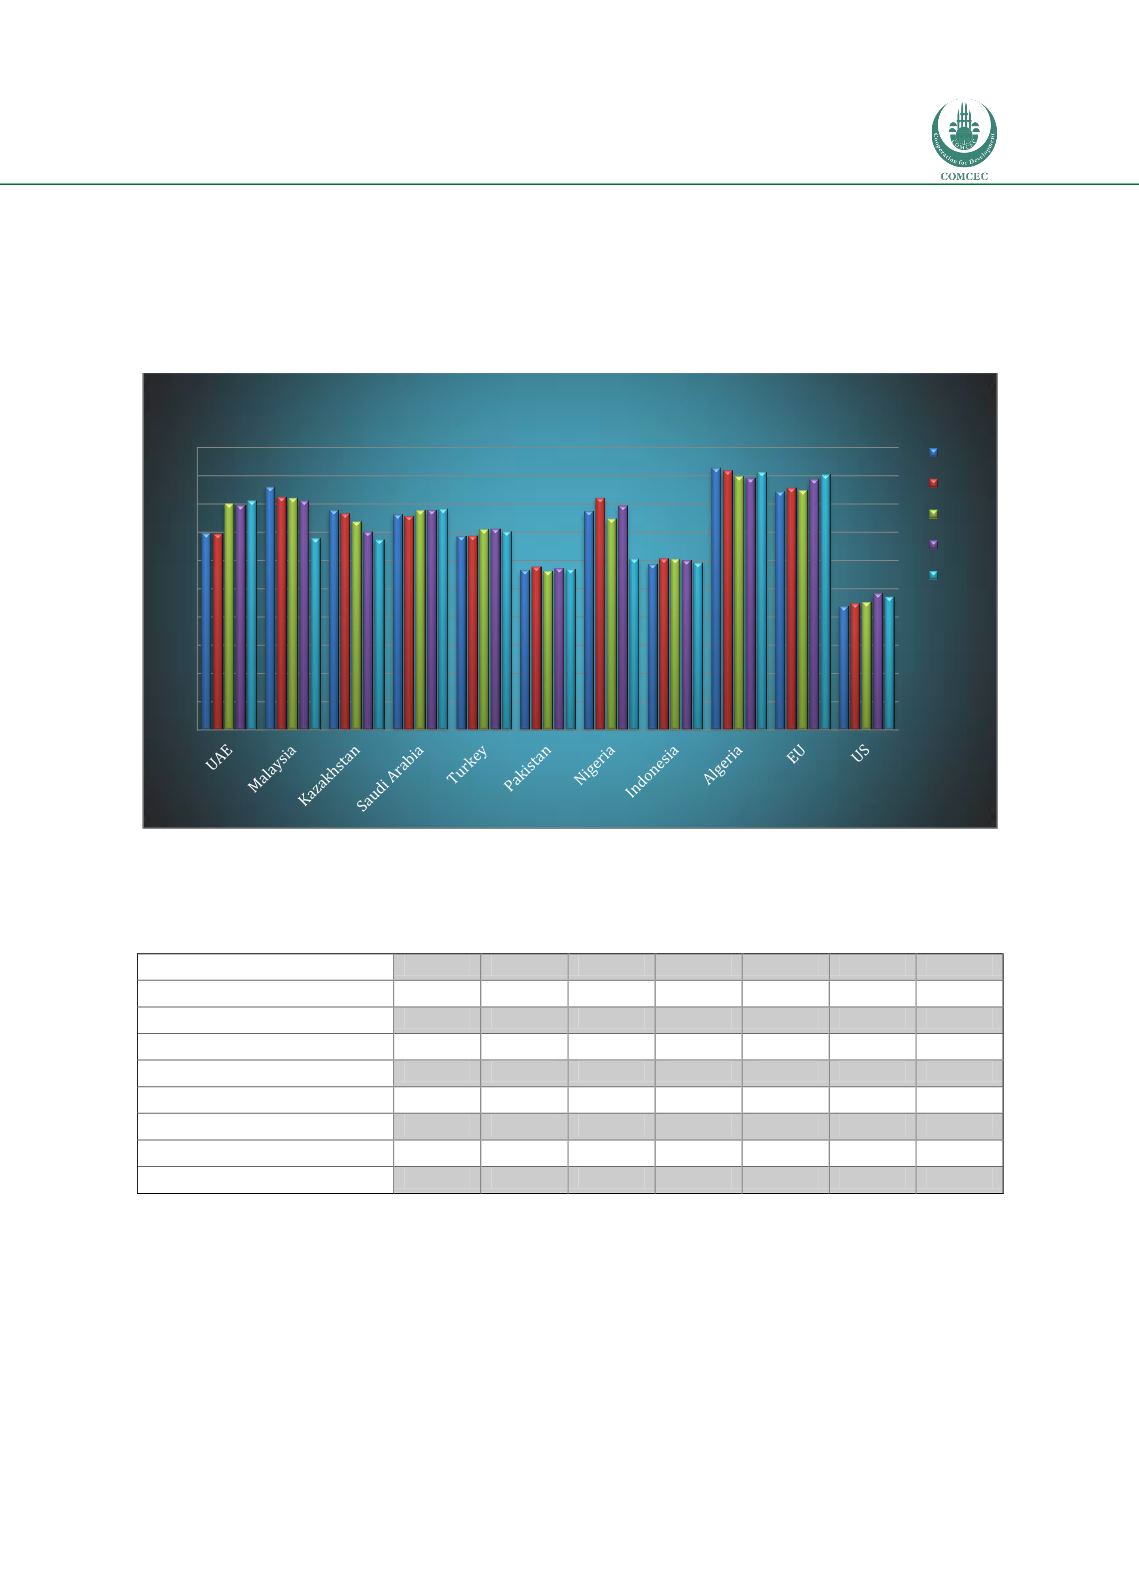
Table 4: Asset Concentration for the selected OIC countries (Herfindahl Index)
2007
2008
2009
2010
2011
2012
2013
Algeria
0.25
0.23
0.19
0.19
0.19
0.17
N/A
Saudi Arabia
0.12
0.12
0.12
0.12
0.12
0.12
0.12
United Arab Emirates
0.11
0.10
0.11
0.10
0.11
0.11
0.11
Indonesia
0.16
0.13
0.12
0.12
0.12
0.11
N/A
Turkey
0.11
0.10
0.11
0.10
0.10
0.10
0.09
Kazakhstan
0.14
0.12
0.11
0.11
0.10
0.09
N/A
Pakistan
0.08
0.08
0.07
0.08
0.07
0.08
0.08
Malaysia
0.07
0.07
0.07
0.06
0.09
0.07
0.09
Nigeria
0.06
0.06
0.07
0.07
0.06
0.06
N/A
Source: Bankscope
We investigate banks' asset concentration using the Herfindahl-Hirschman index. This ratio
lies between 0 and 1 and an index closer to 1 indicates a higher concentration. 25% is usually
used as a cut-off value for medium level of concentration. As of 2013, none of the OIC member
countries seem to have a banking system with relatively high asset concentration.
The effect of banking concentration on financial stability is not a fully resolved issue. As stated
in a recent World Bank Study (Global Financial Development Report, 2013), some researchers
believe that government support of the largest banks increased banking concentration,
0
10
20
30
40
50
60
70
80
90
100
Five Largest Banks Asset Concentration
2007
2008
2009
2010
2011