


 36 / 176

Improving Banking Supervisory Mechanisms
In the OIC Member Countries
19
banking size. Therefore, there is still a room for a growth in banking sector for OIC countries.
However, in order to make this growth to be sustainable, an important regulatory and
supervisory effort should be paid.
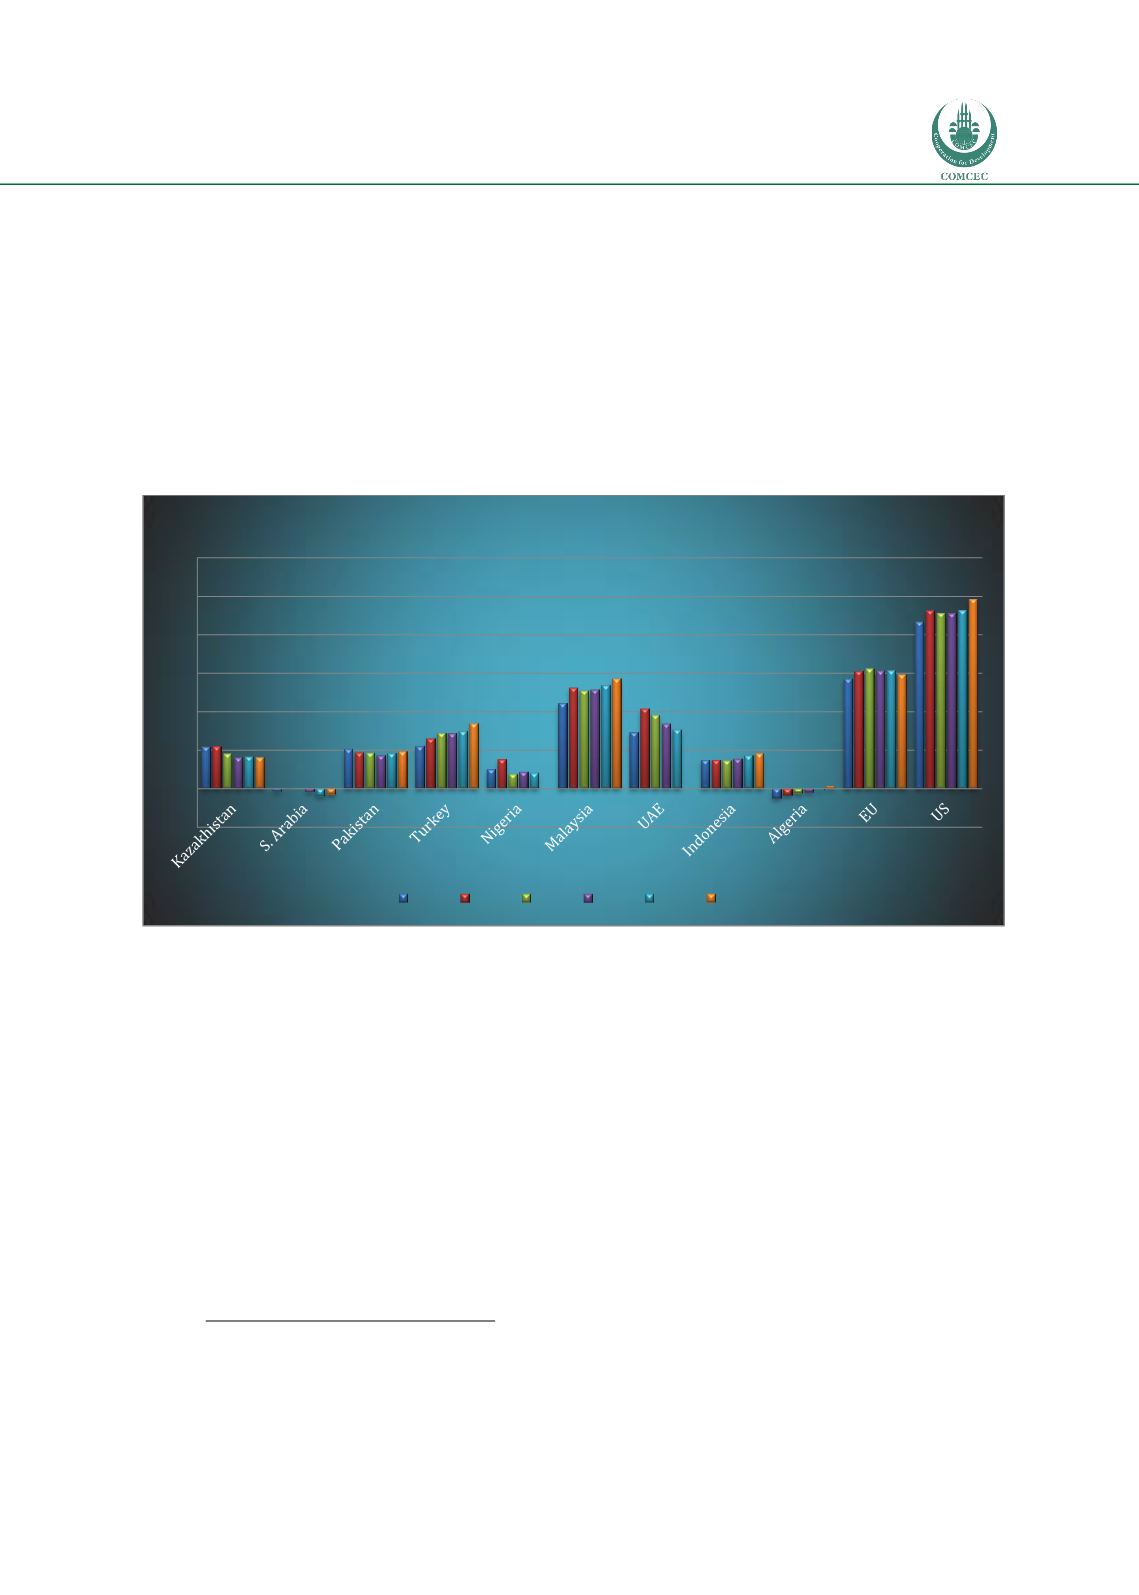
Figure 5 presents domestic credit provided by the financial sector in OIC member countries.
The average is way below 100%, which can be considered as a benchmark. Domestic credit
levels, which show a significant increase in most member states, indicate a credit boom
,2F
13
which should be monitored closely by regulatory agencies. On the other hand, the comparison
to Euro area and US shows that there is still room for potential credit expansion as the level of
credit still fall significantly behind of the developed economies. Malaysian banking sector
seems to be most active one in terms of its lending activity.
Figure 5: Domestic Credit Provided by Financial Sector
Source: World Bank
Banking sector penetration can be measured the number of individuals using banking services.
Number of ATM can be a proxy for measuring banking penetration. In the selected OIC
countries we observe a relatively small banking penetration compared to US and EU countries.
This implies that relatively fewer households in the OIC member states have bank accounts or
do make financial transactions through banking system. As can be seen from the below figures,
the number of ATM's per 100,000 adults in OIC member states are three times lesser than that
of US and EU members.
13
Dell’ Ariccia et al (IMF, 2012) classified an episode of credit boom if either of the following two conditions is satisfied: (i)
the deviation from trend is greater than 1.5 times its standard deviation and the annual growth rate of the credit-to-GDP
ratio>10%; or (ii) the annual growth rate of the credit-to-GDP ratio exceeds 20%. The second condition is introduced to
capture episodes in which aggregate credit accelerates very gradually but credit growth reaches levels that are well above
those previously observed in the country.
-50
0
50
100
150
200
250
300
Domestic Credit Provided by Financial Sector (% of GDP)
2008 2009 2010 2011 2012 2013