


 19 / 113

COMCEC Trade Outlook 2017
13
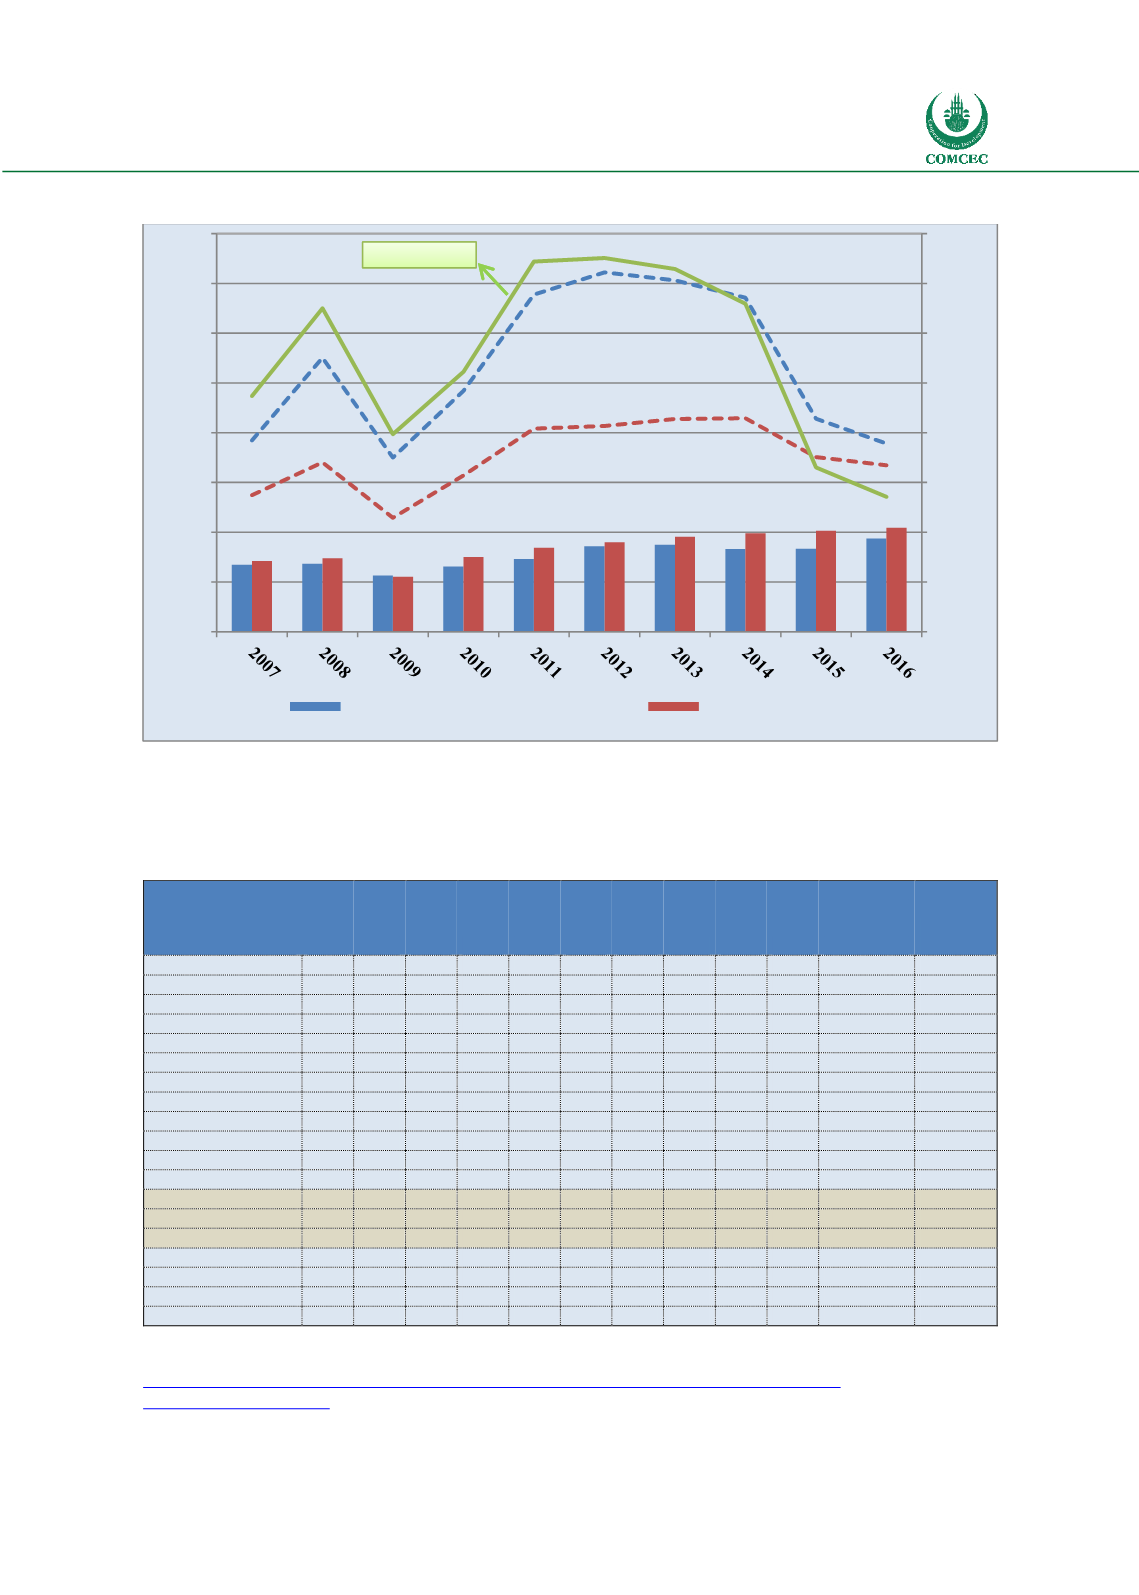
Figure 12: Export Value versus Export Volume Indices for the World and the OIC
Source: IMF, UNCTADSTAT
Table 2 illustrates that Saudi Arabia, Iran, Iraq and Kuwait were among the major oil exporting
OIC countries that increased their oil production in 2016 compared to the previous year.
Table 2: Oil Production thousand barrels daily
2007 2008 2009 2010 2011 2012 2013 2014 2015 2016
Growth
Rate
Annual (%)
2016
Share (%)
2016
Saudi Arabia
10268 10663 9663 10075 11144 11635 11393 11505 11986 12349
3.0
13.4
Iran
4359 4421 4292 4417 4465 3819 3615 3725 3897 4600
18.0
5.0
Iraq
2143 2428 2452 2490 2801 3116 3141 3285 4031 4465
10.8
4.8
UAE
3002 3027 2725 2895 3320 3401 3627 3674 3928 4073
3.7
4.4
Kuwait
2660 2784 2498 2560 2913 3169 3129 3101 3068 3151
2.7
3.4
Nigeria
2314 2109 2185 2471 2408 2370 2270 2347 2329 2053
-11.9
2.2
Qatar
1267 1438 1421 1638 1834 1931 1906 1886 1890 1899
0.5
2.1
Kazakhstan
1415 1485 1609 1676 1684 1664 1737 1710 1695 1672
-1.4
1.8
Algeria
1992 1969 1775 1689 1642 1537 1485 1589 1558 1579
1.4
1.7
Oman
710
757
813
865
885
918
942
943
981 1004
2.4
1.1
Indonesia
972 1006
994 1003
952
918
882
852
841
881
4.8
1.0
Azerbaijan
856
895 1014 1023
919
872
877
849
840
826
-1.6
0.9
Total World
82334 82894 81222 83251 84026 86183 86606 88826 91704 92150
0.5
100.0
of which: OPEC
35269 36303 33997 35086 35988 37480 36561 36573 38133 39358
3.2
42.7
Non-OPEC 47065 46591 47225 48166 48038 48703
50045 52254 53572
52792
-1.5
57.3
memo item:
US
6860 6784 7263 7549 7862 8894 10073 11779 12757 12354
-3.2
13.4
Canada
3290 3207 3202 3332 3515 3740 4000 4271 4389 4460
1.6
4.8
Russian Federation
10044 9951 10140
10367 10519 10642 10780 10838 10981 11227
2.2
12.2
Source: Reproduced from BP Statistical Review of World Energy 2017 Note: Oil production includes crude oil,
shale oil, oil sands and natural gas liquids
http://www.bp.com/en/global/corporate/energy-economics/statistical-review-of-world- energy/downloads.html20
70
120
170
220
270
320
370
420
80
130
180
230
280
330
380
430
480
2000:100 Oil Price Index
2000: 100 Index
OIC Export Volume Index
World Export Volume
Brent Oil Price Index