


 17 / 113

COMCEC Trade Outlook 2017
11
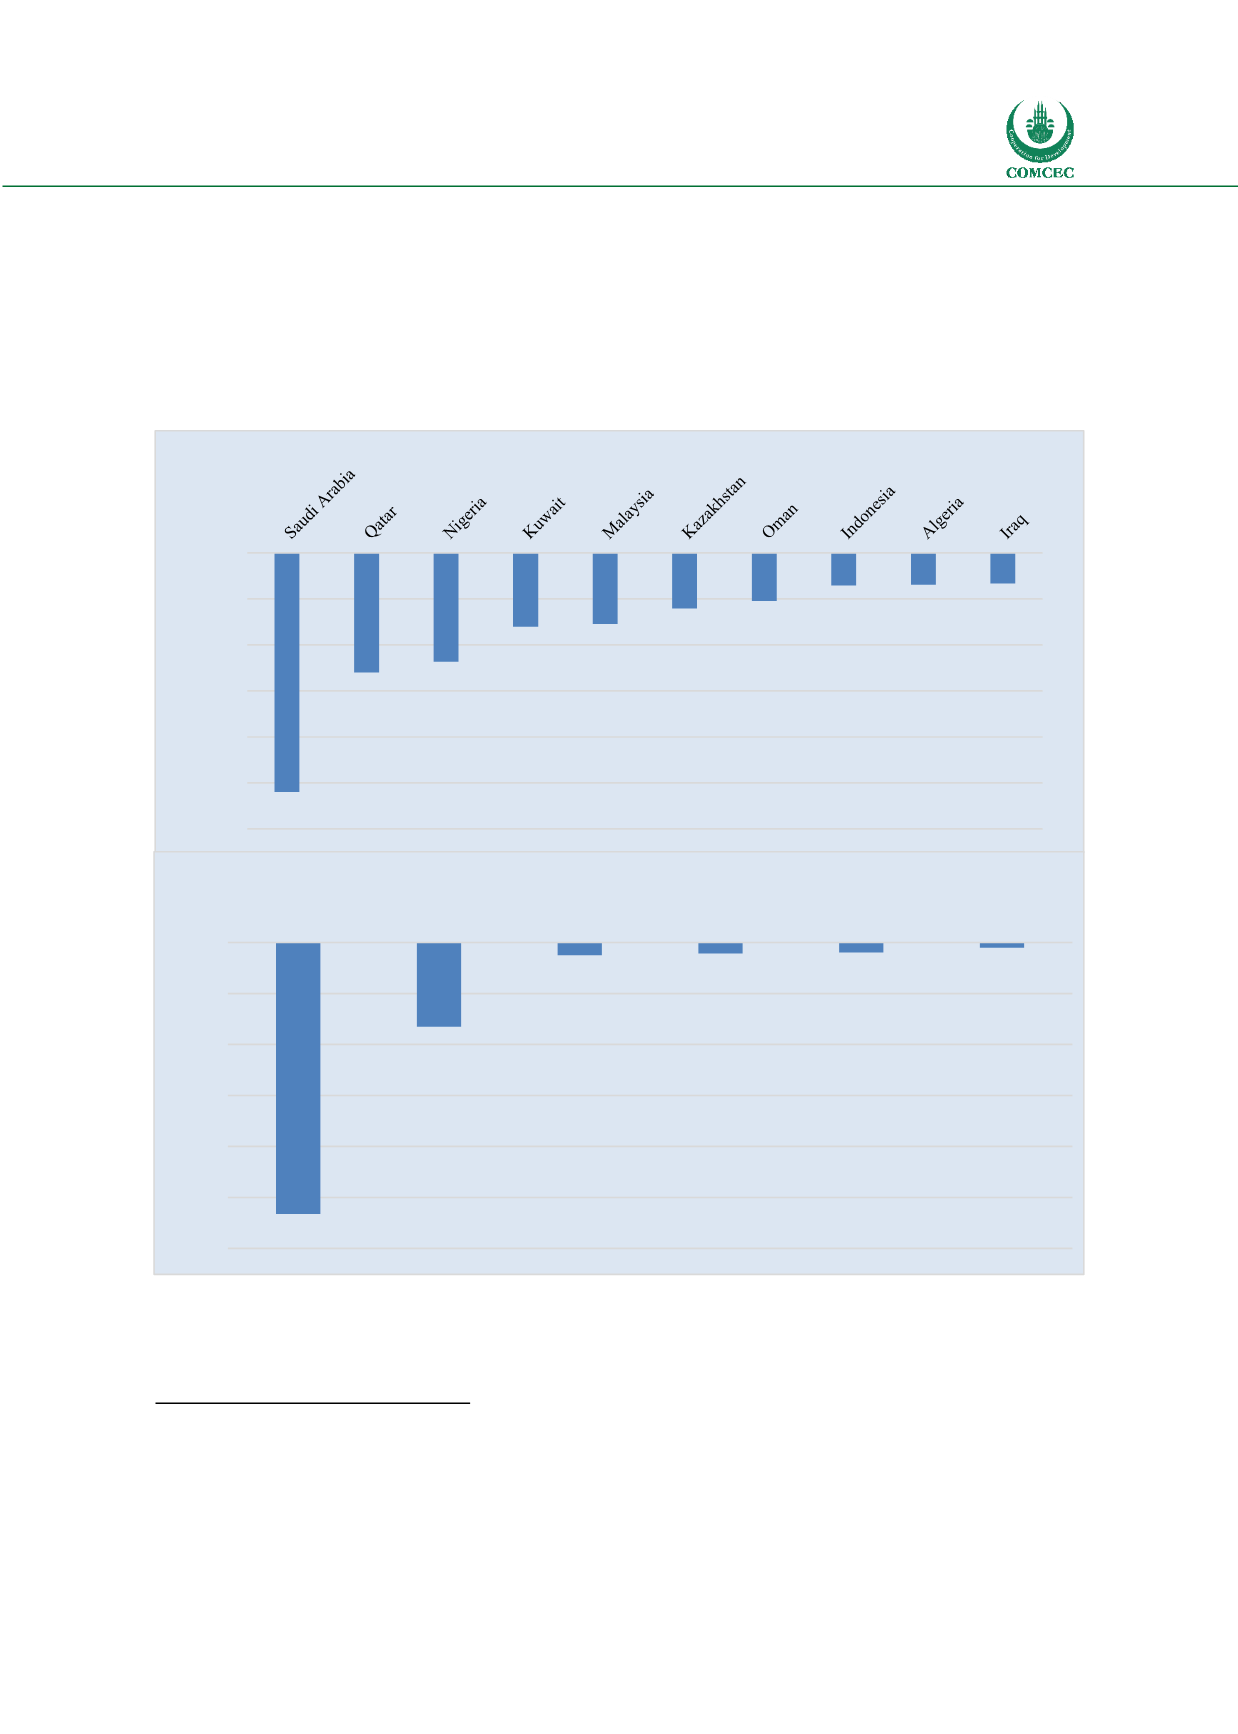
Figure 10 below shows on the left hand side the OIC countries having the largest negative impact
on the percentage fall in the total OIC exports in 2016 in descending order. The fall in exports of
Saudi Arabia accounts for the 28 per cent of the fall in total OIC exports. On the right hand side
of the Figure sectors having the largest negative impact on the fall in total OIC exports takes
place. Accordingly while commodities nes
11
was responsible for the 63 per cent, mineral fuels
and oils were accounted for 19.6 per cent of the decline in total OIC exports.
Figure 10: Contributions (Negative) to Change in Total OIC Exports
Source: ITC Trademap
11
Commodities and transactions not classified elsewhere in the SITC include
s 91- Postal packages not classified
according to kin
d 93 -Special transactions and commodities not classified according to kin
d 96 -Coin (other than
gold coin), not being legal tende
r 97- Gold, non-monetary (excluding gold ores and concentrates)
-2.6
-1.3
-1.2
-0.8
-0.8
-0.6
-0.5
-0.4
-0.3
-0.3
-3.0
-2.5
-2.0
-1.5
-1.0
-0.5
0.0
per cent
Contribution of Countries
-10.7
-3.3
-0.5
-0.4
-0.4
-0.2
-12
-10
-8
-6
-4
-2
0
Commodities nes
Mineral fuels, mineral
oils…
Vehicles other than
railway…
Electrical machinery
and equipment …
Machinery,
mechanical
appliances… Organic chemicals
per cent
Contribution of Sectors