


 21 / 113

COMCEC Trade Outlook 2017
15
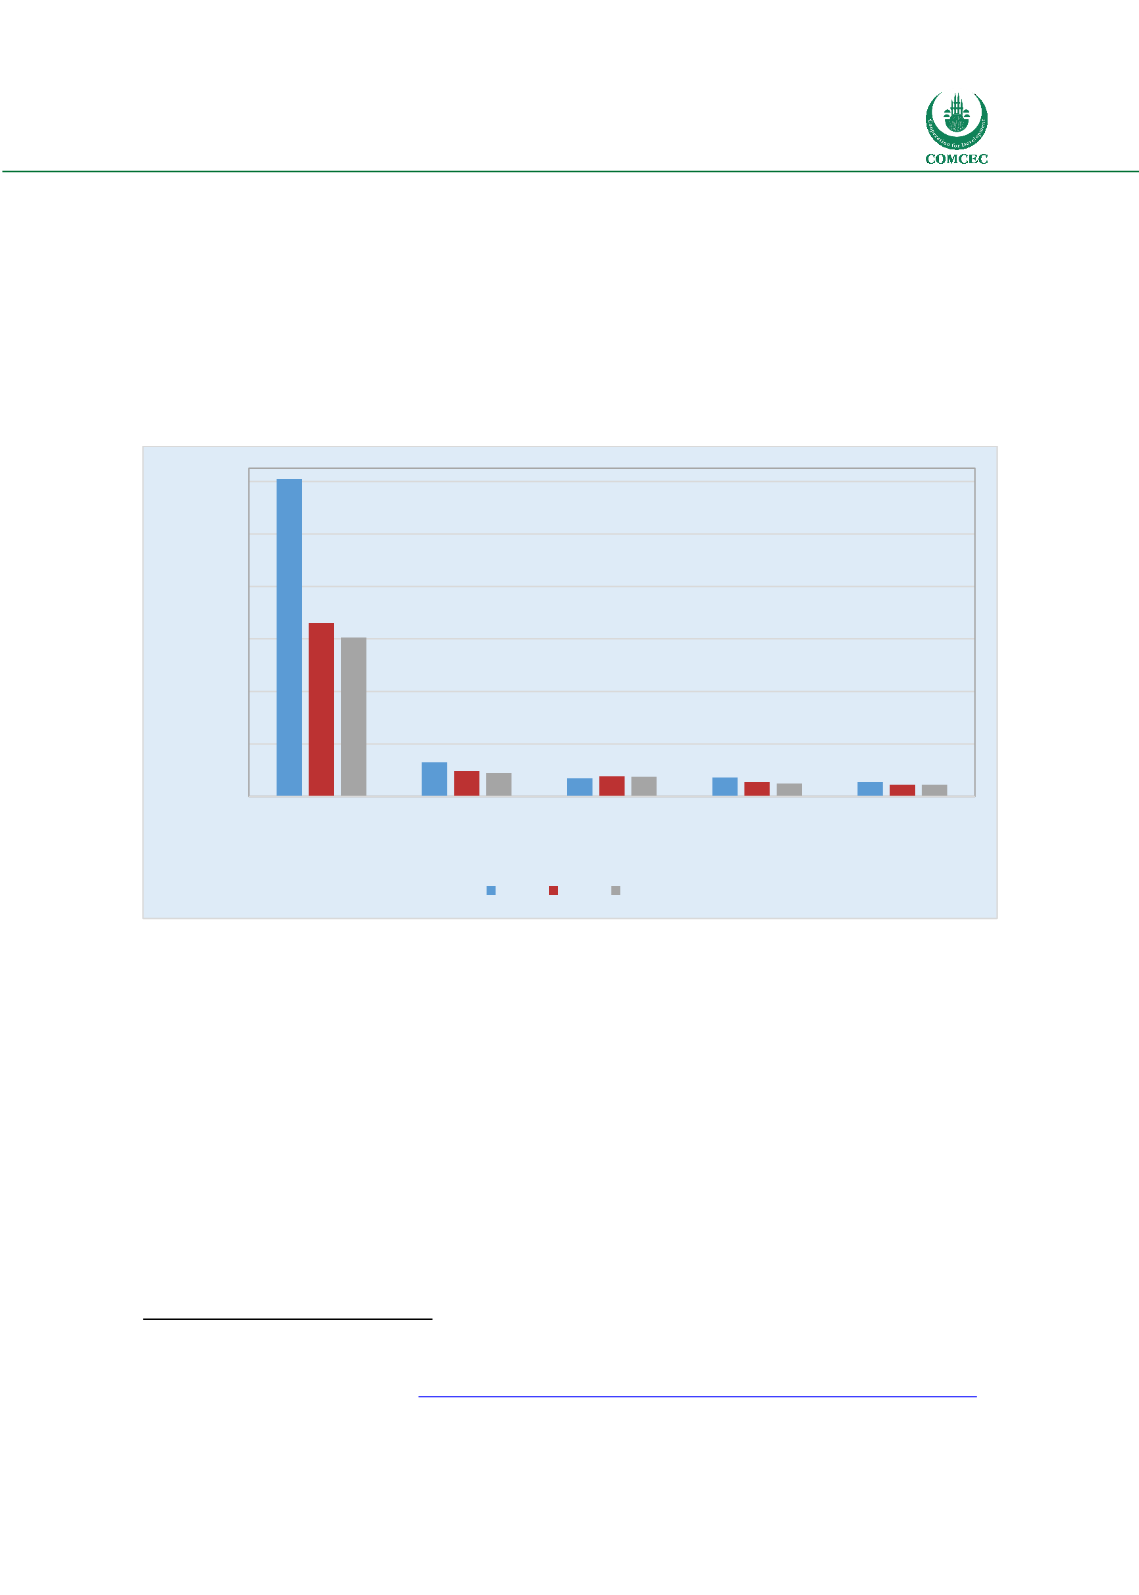
Total OIC exports are highly concentrated. The share of
mineral fuels, oils and distillation products in total OIC
exports was down by 13 percentage points between 2012
and 2016 due to falling oil prices. However mineral fuels,
oils has still the highest share with 43.9 percent in 2016.
This is followed by electrical machinery and equipment, pearls, precious stones, machinery,
mechanical appliances and plastics and articles thereof. These five sectors as a whole account
for 63 per cent of total OIC exports. (Figure 14)
Figure 14: OIC Exports to World- Top 5 Items
Source: ITC Trade map
The resilience of a country against external economic shocks varies depending on among others
the degree of export diversification. One common measure of concentration is Herfindahl-
Hirschmann Index (HHI)
12
which can take values between 0 and 1 where being close to 0
indicates well diversified exports while a higher value indicates greater concentration of exports
on a few commodities. Figure 15 illustrates the evolution of product diversification in the OIC
compared to world and developed and developing countries for the period 2007-2015
measured by HHI. Developed countries export product diversification has not changed much as
these countries have more stable and mature export structures
13
. This measure shows a little
tendency towards increasing product diversification in the OIC countries whereas developing
countries achieved a more diversified exports structure in the same period. Moreover, the
product concentration in the OIC countries exports are well above than those of world and
developed countries. OIC has a HHI of 0.25 whereas developed and developing countries have
HHI of 0,07and 0,09 respectively in 2015.
12
The Herfindahl-Hirschmann Index (HHI) is calculated by taking the square of export shares of all export categories
in the market: This index gives greater weight to the larger export categories and reaches a value of unity when the
country exports only one commodity
. http://unctadstat.unctad.org/wds/TableViewer/tableView.aspx?ReportId=12013
WTO World Tariff Profiles, 2017
0
200
400
600
800
1000
1200
Mineral fuels, mineral
oils ...
Electrical machinery-
equipment…
Natural or cultured
pearls, precious or
semi-precious stones,
Machinery,
mechanical
appliances, …
Plastics and articles
thereof
Billion Dollars
2014 2015 2016
“OIC exports are
dominated by mineral
fuels and oils”