


 20 / 113

COMCEC Trade Outlook 2017
14
2.1.
MAIN CHARACTERISTICS OF TOTAL OIC EXPORTS
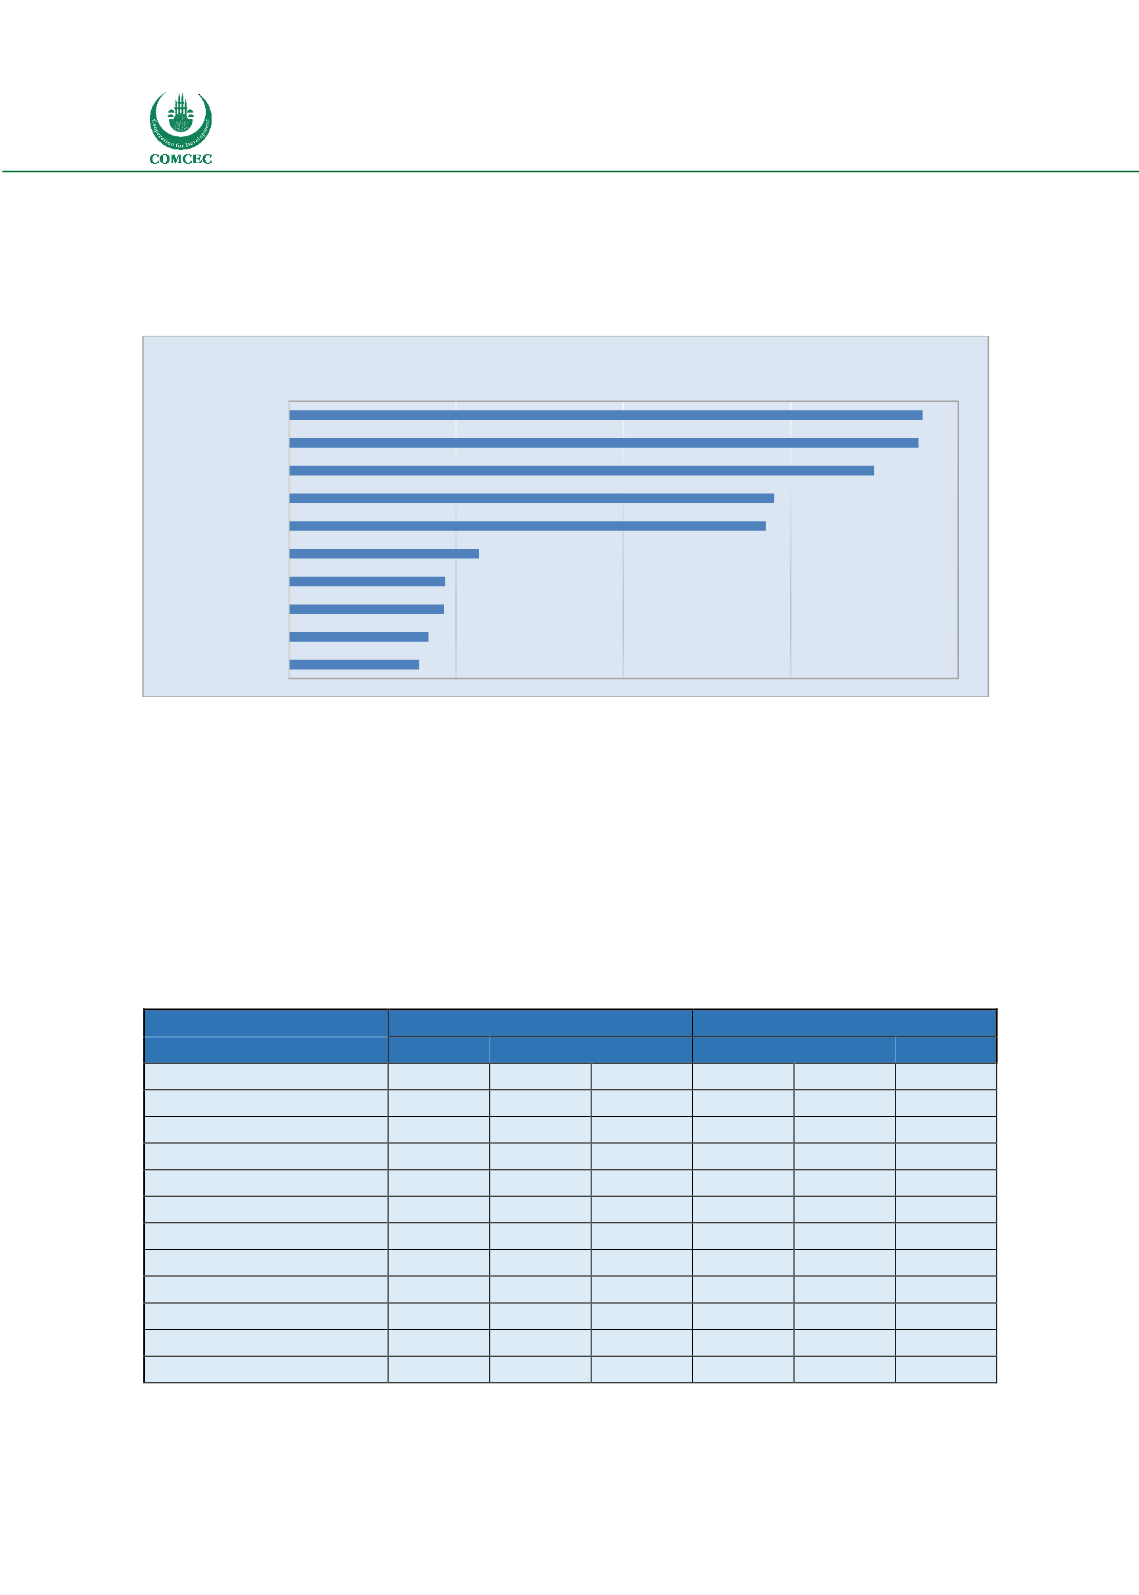
The top performers in total OIC exports were United Arab Emirates, Malaysia, Saudi Arabia,
Indonesia and Turkey together accounting for 61 per cent of total OIC exports.
Figure 13: OIC Exports to World (Top Exporters, 2016)
Source: IMF Direction of Trade Statistics
The OIC export markets are highly concentrated (Table 3).
Although the share of China is declining in extra-OIC exports
in recent years, China is the top export destination with 10.3
per cent of extra-OIC exports destined to China in 2016. Apart
from China OIC exports are mainly shipped to developed
countries in recent years. The top ten countries accounts for 52.3 per cent of extra-OIC exports.
This points to a high country concentration in total OIC exports which makes OIC countries
vulnerable to external shocks that might result from decreasing demand in these countries
and/or falling commodity prices.
Table 3: Major Destinations of Total Extra-OIC Exports
(Billion Dollars)
Share %
Countries
2014
2015
2016
2014
2015
2016
China
234.0
161.0
140.3
11.1
10.6
10.3
India
175.9
119.2
104.7
8.3
7.9
7.7
United States
143.9
98.0
97.3
6.8
6.5
7.1
Japan
202.6
120.2
92.0
9.6
7.9
6.7
Korea
133.4
79.2
62.9
6.3
5.2
4.6
Singapore
96.0
66.2
61.5
4.6
4.4
4.5
Italy
71.4
49.1
46.5
3.4
3.2
3.4
France
57.4
41.8
38.1
2.7
2.8
2.8
Germany
42.9
36.0
35.5
2.0
2.4
2.6
Netherlands
55.4
39.6
33.6
2.6
2.6
2.5
European Union
395.5
301.0
278.0
18.8
19.9
20.4
Total of Top Ten Countries
1212.9
810.3
712.5
57.5
53.6
52.3
Source: IMF Direction of Trade Statistics
189
188
175
145
143
57
47
46
42
39
0
50
100
150
200
UAE
Malaysia
Saudi Arabia
Indonesia
Turkey
Qatar
Iran
Iraq
Kuwait
Nigeria
Billion Dollars
“The country
concentration of total
OIC exports is high”