


 18 / 113

COMCEC Trade Outlook 2017
12
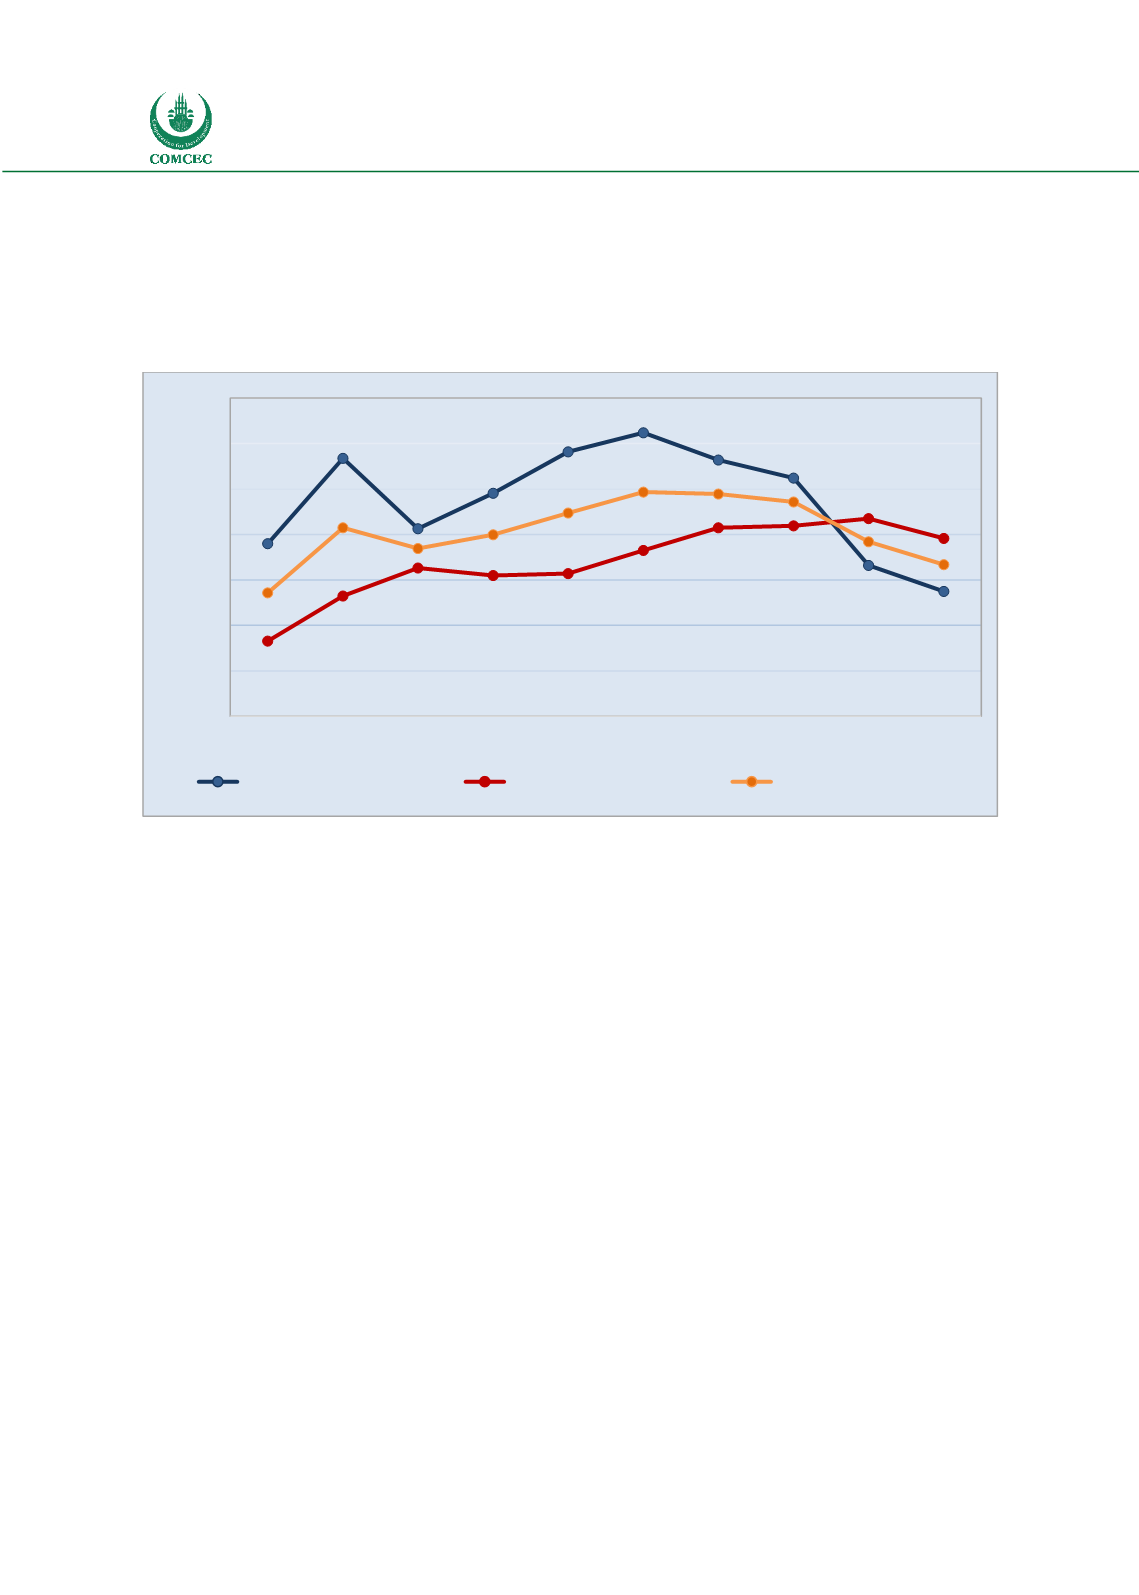
Although the share of OIC countries in world exports
peaked at 12.2 per cent in 2012, it has been declining since
then. Along with the decline in OIC’s share in world imports
the share of OIC countries in global trade further declined
to 9.3 per cent in 2016 down from 9.8 per cent in 2015.
Figure 11: Share of OIC in Global Trade
Source: IMF Direction of Trade Statistics
Figure 12 below demonstrates evolution of the value
versus volume (i.e. eliminating the effects of prices and
exchange rates) developments in total OIC and world
exports. In value terms (i.e. in US dollars), OIC exports
yielded higher growth rates than that of world exports
which was more prominent during the oil price boom
period between 2003 and 2012. Total OIC exports
moves closely with oil prices owing to heavy dominance of oil in OIC exports. As a result OIC
exports have been on a declining trend mainly due to the recent slump in oil prices. On the other
hand thanks to the increased supply especially in fuels, the total OIC exports in volume terms
(i.e. eliminating the effects of prices and exchange rates) increased by 6.2 per cent in 2016.
6
7
8
9
10
11
12
13
2007 2008 2009 2010 2011 2012 2013 2014 2015 2016
Per cent
OIC Exports / World Exports
OIC Imports / World Imports
OIC Trade / World Trade
“OIC countries’ share in
global trade receded to
9.3 per cent in 2016”
“Due to increased supply in
oil, OIC export volume
increased despite fall in
export values in 2016”