


 15 / 113

COMCEC Trade Outlook 2017
9
2.
TRADE BETWEEN OIC AND THE WORLD
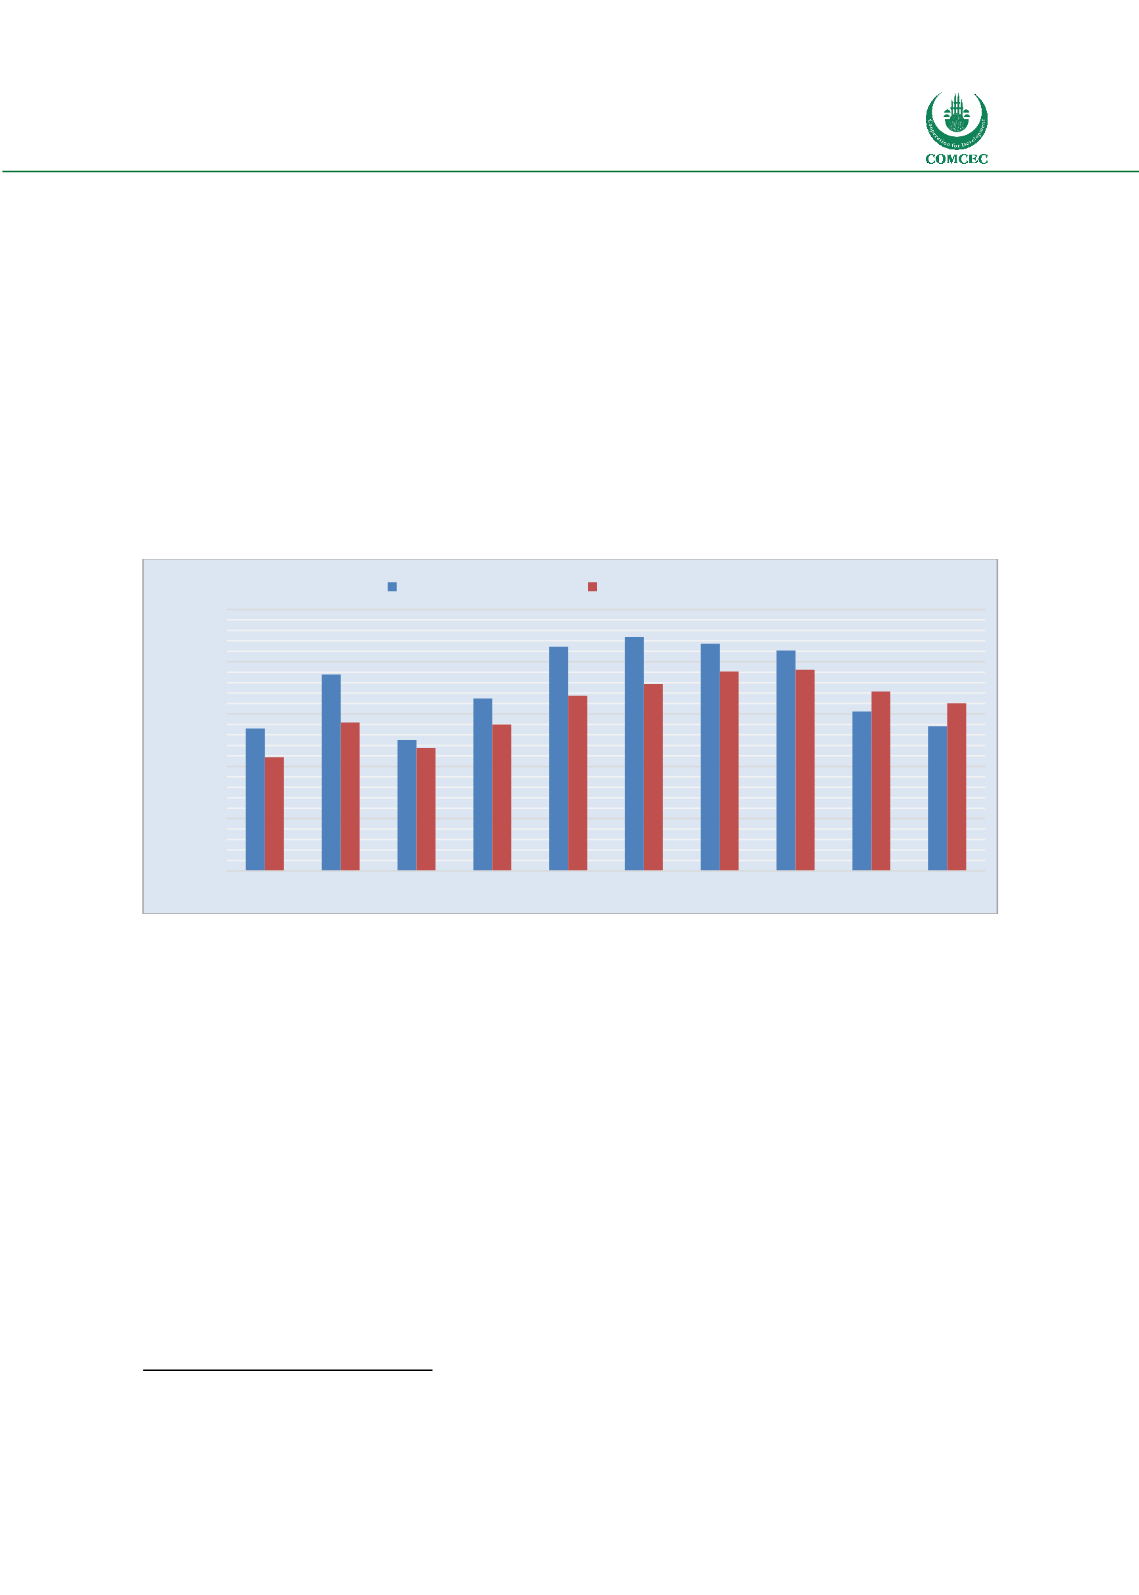
Total OIC exports have been on a downward trend over
the last four years. Thus, the total OIC exports
continued to fall by 9.2 per cent in 2016, albeit at a
smaller pace when compared to the fall in 2015 (27.7
per cent). Thus total OIC exports which hovered
around 2.2 to 2.1 trillion dollars between 2012 to 2014
period fell to 1.4 trillion dollars in 2016. On the other
hand total OIC imports which continued to increase modestly over the 2012 and 2014 period,
fell by 6.6 per cent in a second consecutive year in 2016 to USD 1.6 trillion. Thus total OIC trade
fell by 7.8 per cent to 3.0 trillion dollars in 2016 down from 3.2 trillion dollars in 2015.
Figure 7: Total OIC Exports and Imports
Source: IMF Direction of Trade Statistics
Several factors accounted for the decline in total OIC exports in 2016 including the weak world
demand growth, fall in commodity prices in particular downward trend in oil prices, US dollars
appreciation and ongoing political transition in many countries in Middle East.
On the other hand, import demand of especially oil exporters of OIC declined mainly due to the
negative impacts of low oil prices on economic activity. The fall in the imports of Saudi Arabia
alone accounted for 30.3 per cent of the decline in total OIC imports in 2016.
Growth performance and rebalancing of Chinese economy away from manufacturing and
investment to services and consumption being the main export market for OIC countries is
particularly important as further slowdown in Chinese growth might have negative implications
on OIC exports. Chinese economy maintained a remarkable growth by growing 10.3 per cent
annually between 2000 and 2011 which led the surge in commodity prices in 2000s. However
the pace of growth has slowed down since 2012 averaging to 7.3 per cent in this period. It is
estimated to be slowing further in the coming years
9
. This could have negative spillovers on OIC
exports via downward pressure on commodity prices and lower import demand.
9
IMF WEO Database.
http://data.imf.org/?sk=388DFA60-1D26-4ADE-B505-A05A558D9A42&sId=1479329328660
0.0
0.5
1.0
1.5
2.0
2.5
2007 2008 2009 2010 2011 2012 2013 2014 2015 2016
TRILLION US $
Merchandise Exports
Merchandise Imports
“Total OIC exports
continued to fall in 2016,
38 per cent down from
their 2012 peaks ”