


 25 / 113

COMCEC Trade Outlook 2017
19
Figure18: Share of Commodities in Total Exports for Selected Countries, 2016
Source: UN Comtrade
https://comtrade.un.org/db/mr/daReportersResults.aspx?bw=GNote: Latest available data were used. * Includes SITC Rev 3 sectors 65 and 84
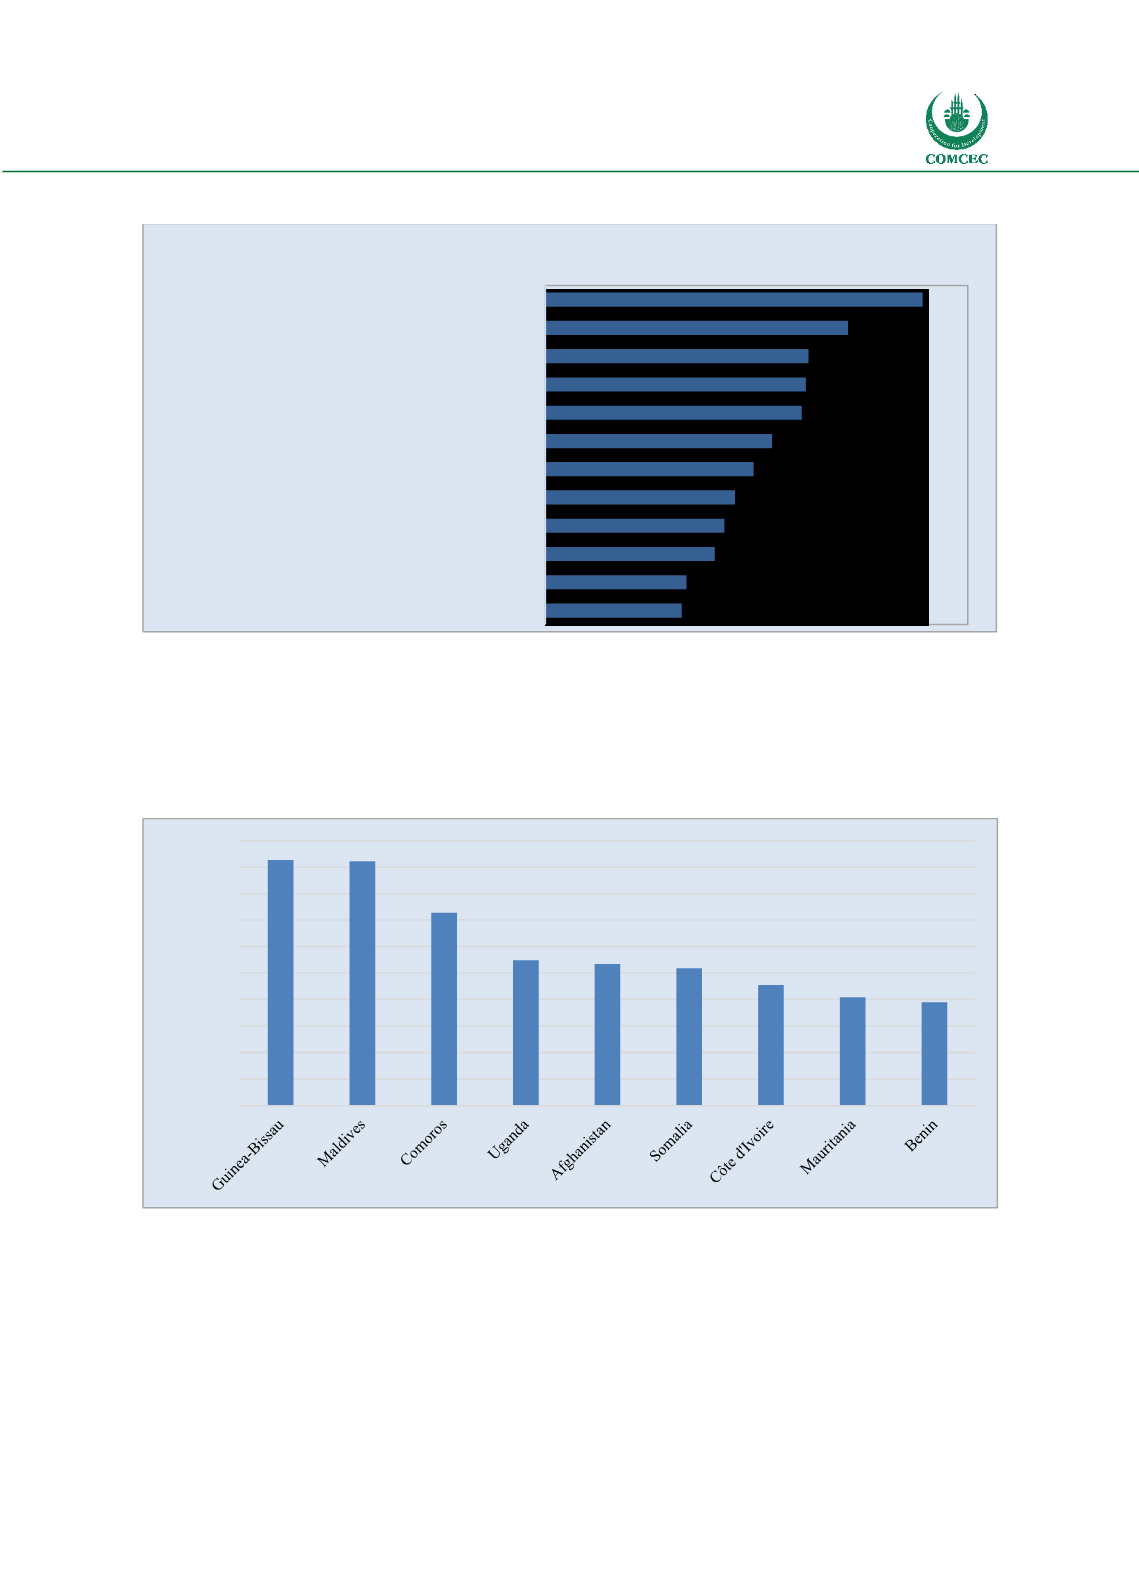
As shown in Figure 19 the share of basic food items such as food and live animals, oil seeds and
animal and vegetable oils constitutes as much as 52 to 93 per cent of exports in Guinea Bissau,
Maldives, Comoros Uganda, Afghanistan and Somalia.
Figure19: Share of Basic Food (SITC 0+22+4) in Total Exports, 2016
Source: UNCTADSTAT
Although the share of manufacturing in total OIC exports is 39.4 per cent in 2016, manufactured
products constitute a considerable part of exports in some OIC countries such as Bangladesh,
Pakistan, Turkey, Malaysia and Morocco where the share of manufactured goods exports in total
exports ranges between 67 to 95 per cent (see Table 4).
Figure 20 illustrates the sectoral breakdown of OIC exports along with the breakdown of
manufacturing exports by degree of manufacturing in 2016. Of the total OIC manufacturing
89
72
62
62
61
54
49
45
42
40
33
32
0
20
40
60
80
100
Bangladesh *(Textile fibres and yarn, clothing)
Mali (Gold-non-monetary)
Pakistan* (Textile fibres and yarn, clothing)
Burkina Faso (Gold,non-monetary)
Gambia (Textile yarn, fabrics, made-up articles)
Sudan (petroluem)
Kyrgyzistan (Gold,non-monetary)
Côte d'Ivoire (Coffee, tea, cocoa, spices, and…
Mauritania (Metalliferous ores and metal scrap )
Guinea (Gold, non monetary)
Mozambique (Nonferrous metals)
Niger (Metalliferous ores and scrap )
Per cent
93
92
73
55
53
52
46
41
39
0
10
20
30
40
50
60
70
80
90
100
Percent