


 16 / 113

COMCEC Trade Outlook 2017
10
Commodity prices, in particular fuels, declined sharply starting from June 2014. Oil prices
(Brent) declined by almost 50 percent from 98.9 dollar per barrel in 2014 to 52.4 dollar per
barrel 2015 mainly due to the shale oil production in US and oversupply in global oil markets.
Although oil prices bottomed out 30 dollars per barrel in January 2016, they recovered partially
in the second half of the year and ended the year 54 dollars per barrel owing to the agreement
by the Organization of the Petroleum Exporting Countries (OPEC) and other producers to cut oil
production and expectations for stronger future global demand.
10
Oil prices averaged 44 dollars
per barrel in 2016 down from 52.4 dollars per barrel in 2015.
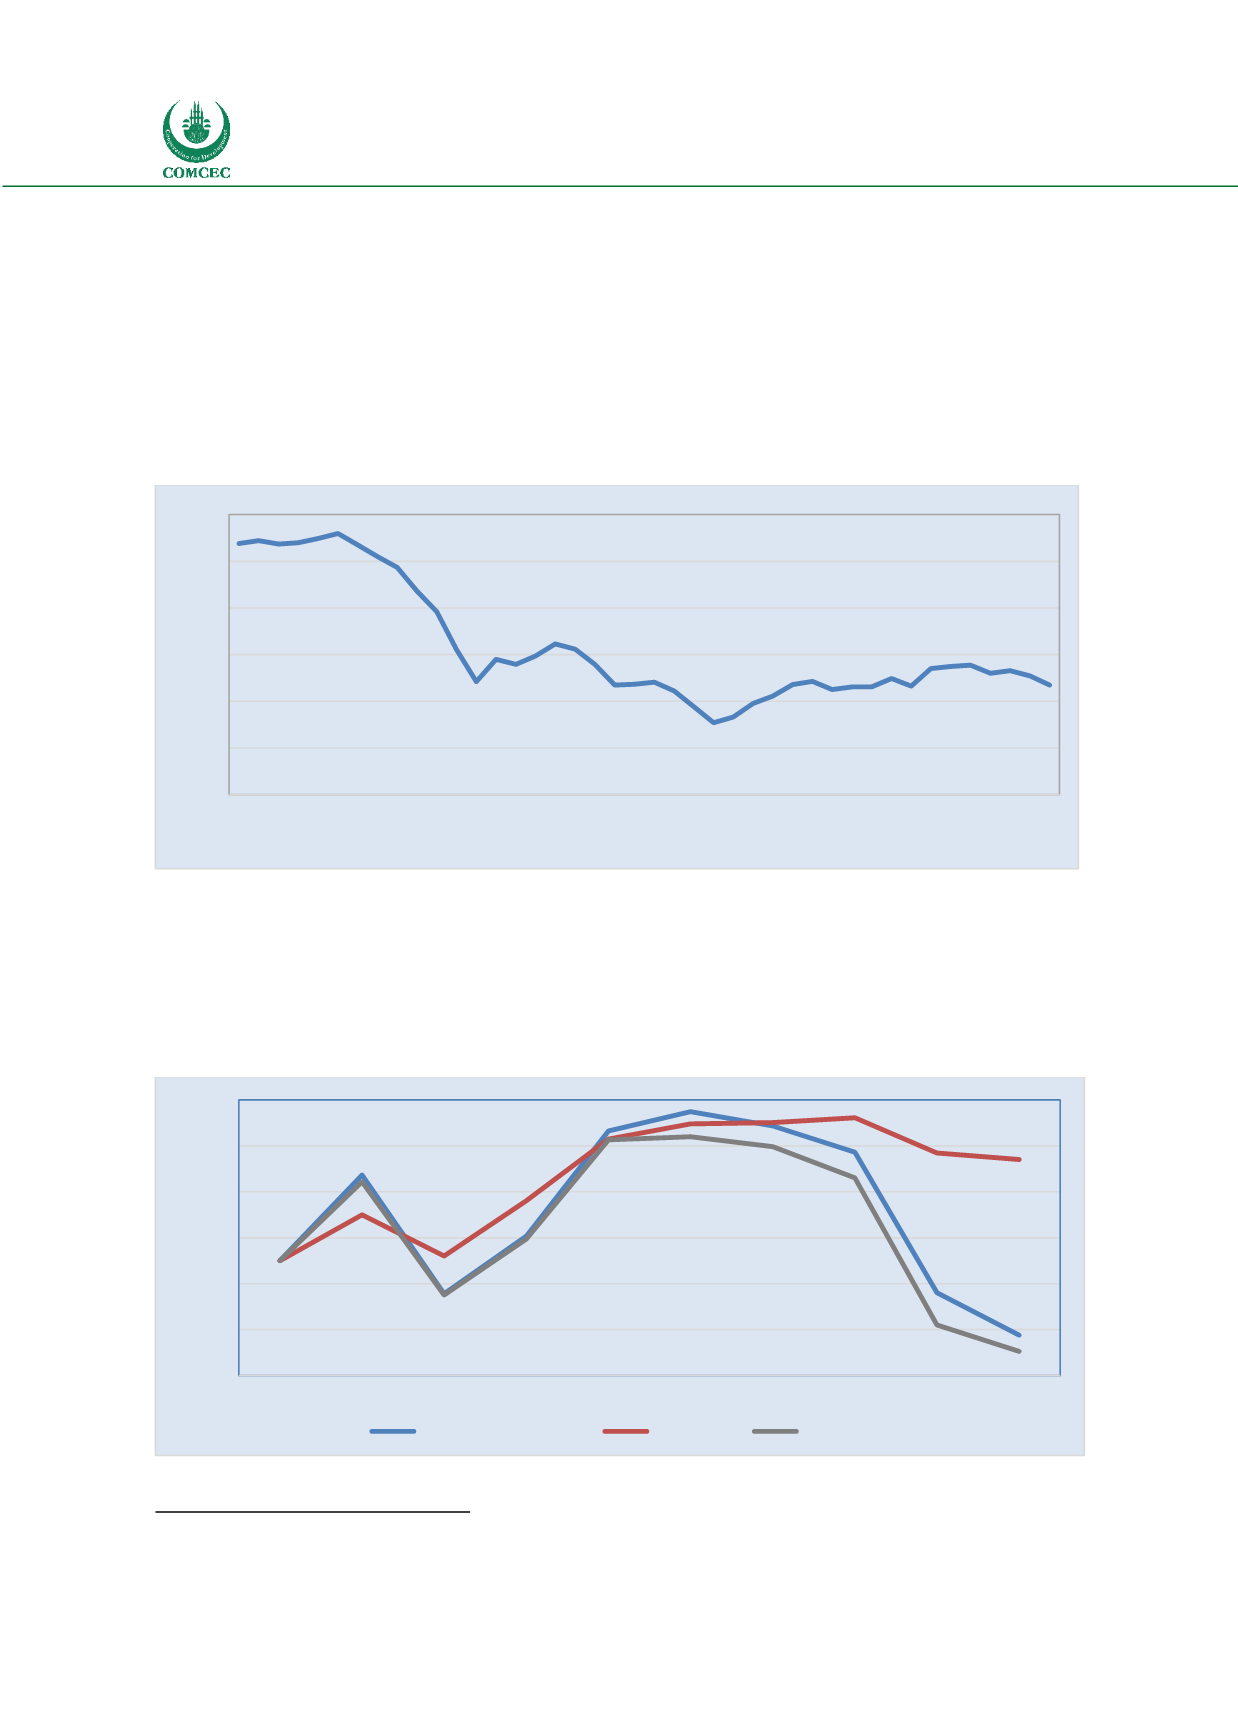
Figure 8: Monthly Oil (Brent) Prices
Source: IMF Commodity Prices database
Figure 9 shows the evolution of total OIC fuels and non-fuels exports versus oil price
developments. Fuels exports are highly volatile depending on the oil price movements. As a
result, OIC fuels exports have been contracted severely over the last three years. OIC non fuels
exports have been weak in the same period however the magnitude of fall being quite smaller.
Figure 9: Evolution of OIC Fuels and Non-Fuels Exports versus Oil Prices
Source: UNCTAD STAT database
10
IMF,
World Economic Outlook, April 2017: Gaining Momentum?
108
112
87
78
62
48
65
56
47
31
39
47
50
47
0
20
40
60
80
100
120
2014M1
2014M2
2014M3
2014M4
2014M5
2014M6
2014M7
2014M8
2014M9
2014M10
2014M11
2014M12
2015M1
2015M2
2015M3
2015M4
2015M5
2015M6
2015M7
2015M8
2015M9
2015M10
2015M11
2015M12
2016M1
2016M2
2016M3
2016M4
2016M5
2016M6
2016M7
2016M8
2016M9
2016M10
2016M11
2016M12
2017M1
2017M2
2017M3
2017M4
2017M5
2017M6
dollars per barrel
50
70
90
110
130
150
170
2007 2008 2009 2010 2011 2012 2013 2014 2015 2016
2007:100 Index
Fuels (SITC 3)
Non Fuel
Oil Prices