


 14 / 113

COMCEC Trade Outlook 2017
8
Table A: Intra and Extra Trade in Selected Preferential Trade Agreements - 2016
World (billion dollars)
Intra-PTA share in total
(%)
Extra-PTA share in total
(%)
Export
Import
Export
Import
Export
Import
ASEAN (Association of South-East Asian Nations)
1,138
1,077
24.0
22.6
76.0
77.4
CEMAC (Economic and Monetary Community of Central
Africa)
18
19
2.9
3.9
97.1
96.1
Commonwealth of Independent States (CIS)
419
316
16.5
21.0
83.5
79.0
Common Market for Eastern and Southern Africa
(COMESA)
69
146
9.9
5.6
90.1
94.4
EAC (East African Community)
14
32
21.7
7.1
78.3
92.9
Economic Co-operation Organization (ECO)
300
359
10.5
7.7
89.5
92.3
Economic Community of West African States (ECOWAS)
73
87
11.7
10.0
88.3
90.0
European Free Trade Association (EFTA)
398
347
0.5
0.6
99.5
99.4
European Union (28)
5,358
5,220
63.7
59.7
36.3
40.3
Gulf Cooperation Council (GCC)
579
451
10.5
9.7
89.5
90.3
Southern Common Market (ME RCOSUR)
283
224
14.0
15.2
86.0
84.8
North American Free Trade Agreement (NAFTA)
2,216
3,040
50.2
33.2
49.8
66.8
SAARC (South Asian Association for Regional
Cooperation)
327
487
7.0
5.4
93.0
94.6
WAEMU (West African Economic and Monetary Union)
24
28
13.5
8.1
86.5
91.9
Source: UNCTADSTAT
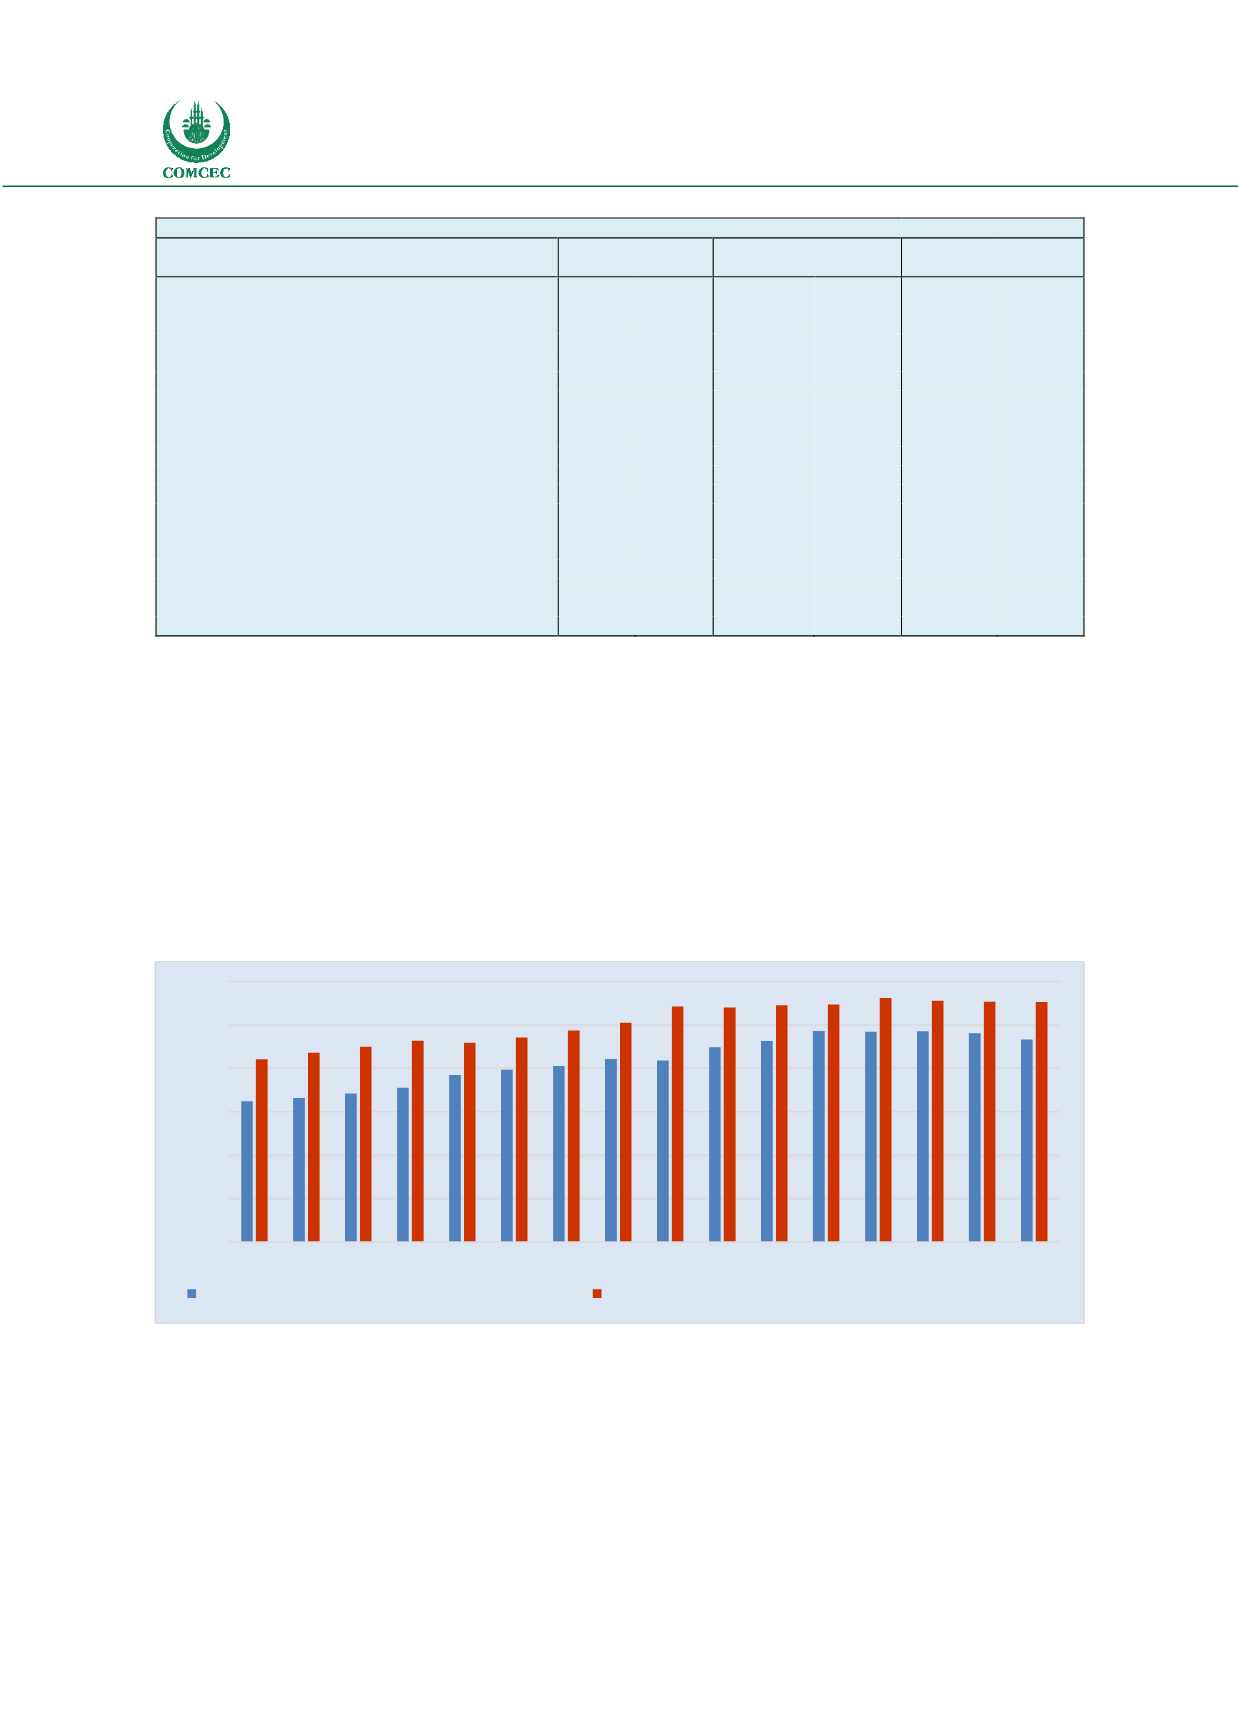
The rising share of developing economies in world trade was the third dominant pattern in the
world trade. The share of developing countries in global exports increased from 32.7 percent in
2001 to 46.5 percent in 2016. The rising share of developing countries in world trade was driven
by the rapid growth in South-South trade (trade between the developing countries) and
especially by the exports of Brazil, Russia, India and China. The high growth of Developing
countries trade is considered as a major driver of the global trade growth in the past decade and
a major factor contributing to recovery from the global crisis. However, since 2013 growth in
developing countries share in world exports has slowed down.
Figure 6: Evolution of the Share of Developing Countries in World Exports
Source: ITC Trademap
Increasing participation to the global value chains (GVCs) in particular of the developing
countries was a key factor driving the dramatic increase in developing countries trade and in
turn the world trade in the period prior to the global crisis. However, a recent trend has been
the slowing pace of global value chains, which have negative impacts on world trade growth.
The shift to domestic production of intermediate inputs by China, Japan and US firms
contributed to the slowdown in GVCs.
0
10
20
30
40
50
60
2001 2002 2003 2004 2005 2006 2007 2008 2009 2010 2011 2012 2013 2014 2015 2016
per cent
Developing countries exports as % of world exports
South-South exports as % of total Developing Countries Exports