


 13 / 113

COMCEC Trade Outlook 2017
7
2016, all members participate to the existing RTAs or initiate new ones. The European
Union, The European Free Trade Association (EFTA), The North American Free Trade
Agreement (NAFTA), The Southern Common Market (MERCOSUR), The Association of
Southeast Asian Nations (ASEAN) Free Trade Area (AFTA), and the Common Market of Eastern
and Southern Africa (COMESA) are among the best known RTAs. WTO notes that most of both
the existing RTAs in force and the new negotiations are bilateral. However there is a new trend
for plurilateral RTAs involving several WTO members. Among these are the Asia-Pacific Region
for a Trans-Pacific Partnership (TPP) Agreement, the Pacific Alliance in Latin America and the
Tripartite Agreement between parties to COMESA, EAC and SADC in Africa
8
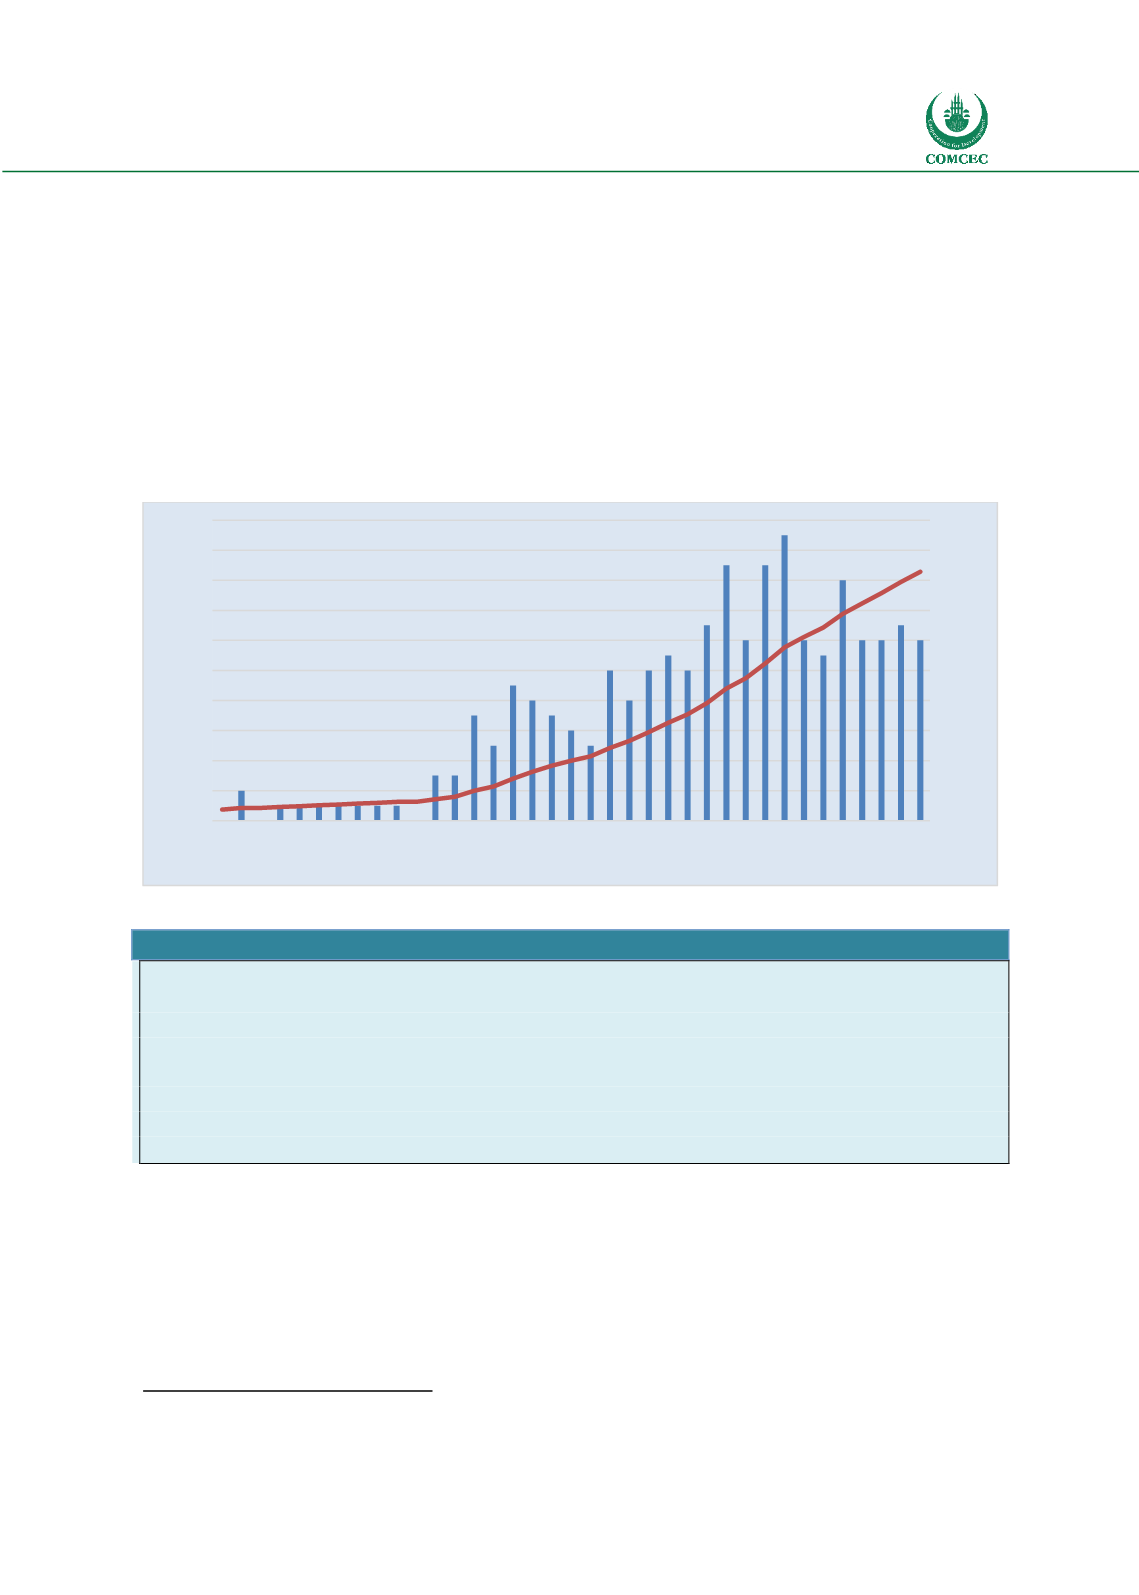
. As of July 2017, the
number of RTAs in force reached 293. Figure 5 shows the increasing number of RTAs since 1980.
Figure 5: Evolution of RTAs (in force) in World
Source: WTO database
Box 1: Regional Trade Agreements
Table-A below could be used to evaluate whether the steady increase in the number of regional
agreements in recent years affected the trade between member countries. As may be observed
from the table, the EU has the largest intra-trade shares, with intra-export and intra-import
shares were 64 per cent and 60 per cent respectively. For NAFTA, intra-export was 50 per cent
while intra-imports was 33 percent. However in ASEAN, most of the trade (77 per cent) was
with the countries out of the agreement. On the other hand, when some RTAs in the OIC region
evaluated; intra-export shares in total trade remained small for GCC, ECO, ECOWAS andWAEMU
ranging between 8 to 14 per cent.
8
https://www.wto.org/english/tratop_e/region_e/regfac_e.htm0
50
100
150
200
250
300
350
0
2
4
6
8
10
12
14
16
18
20
1980
1981
1982
1983
1984
1985
1986
1987
1988
1989
1990
1991
1992
1993
1994
1995
1996
1997
1998
1999
2000
2001
2002
2003
2004
2005
2006
2007
2008
2009
2010
2011
2012
2013
2014
2015
2016
Cumulative Number
Number per year