


 15 / 125

COMCEC Trade Outlook 2019
8
Box 1: Regional Trade Agreements
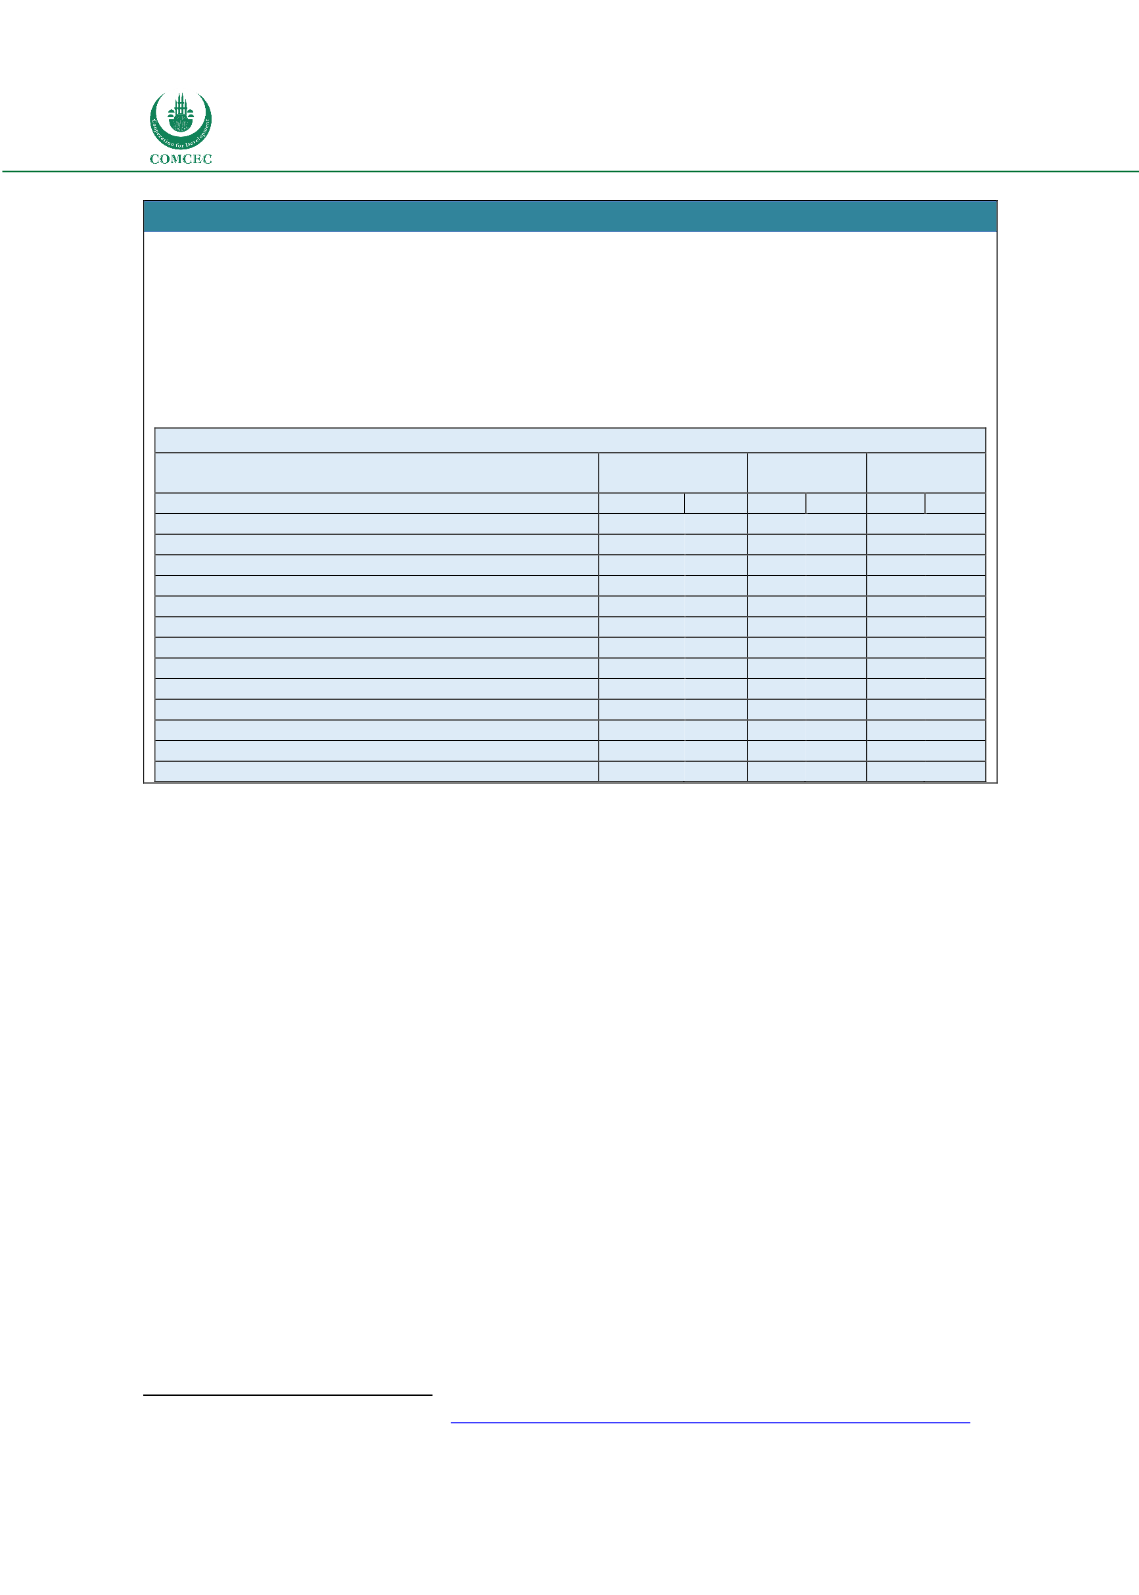
Table A: Intra and Extra Trade in Selected Preferential Trade Agreements – 2018
Table-A below could be used to evaluate whether the steady increase in the number of regional agreements
in recent years affected the trade between member countries. As may be observed from the table, the EU has
the largest intra-trade shares, with intra-export and intra-import shares were 63.6 percent and 59.3 percent
respectively. For NAFTA, intra-export was 49.4 percent while intra-imports was 33.1 per cent. However in
ASEAN, most of the export (75.9 per cent) was with the countries out of the agreement. On the other hand,
when some RTAs where some OIC member countries participated evaluated; intra-export shares in total
trade remained small for GCC, ECOWAS and WAEMU ranging between 8.1 to 12.7 per cent.
Table A: Intra and Extra Trade in Selected Preferential Trade Agreements - 2018
World
(Billion Dollars)
Intra-PTA Share
in Total (%)
Extra-PTA Share
in Total (%)
Export
Import Export Import Export Import
ASEAN (Association of Southeast Asian Nations)
1,448
1,437
24.1
22.3
75.9
77.7
CEMAC (Economic and Monetary Community of Central Africa)
29
17
2.9
5.1
97.1
94.9
CIS (Commonwealth of Independent States)
595
360
12.8
21.2
87.2
78.8
COMESA (Common Market for Eastern and Southern Africa)
115
196
11.9
6.5
88.1
93.5
EAC (East African Community)
14
36
18.7
7.7
81.3
92.3
ECOWAS (Economic Community of West African States)
109
99
8.1
8.8
91.9
91.2
EFTA (European Free Trade Association)
437
377
0.5
0.7
99.5
99.3
EU28 (European Union)
6,446
6,389
63.6
59.3
36.4
40.7
GCC (The Cooperation Council for the Arab States of the Gulf)
865
497
9.9
13.2
90.1
86.8
MERCOSUR (Southern Common Market)
351
278
12.2
14.8
87.8
85.2
NAFTA (North American Free Trade Agreement)
2,566
3,536
49.4
33.1
50.6
66.9
SAARC (South Asian Association for Regional Cooperation)
399
680
7.9
5.1
92.1
94.9
WAEMU (West African Economic and Monetary Union)
27
37
12.7
9.9
87.3
90.1
Source: UNCTADSTAT
Though the value of exports of goods and services from developing countries has increased
notably since 2000, this growth has not outpaced the developed world. Developing countries’
share in global exports has not grown since 2012. The growth of global exports has levelled off
since 2012 and the same is true for the developing economies. In 2018, the total value of exports
originating from developing countries was 4.3 times higher than in 2000. Developing countries’
share of global exports of goods and services has risen from 29.7 per cent in 2000 to 41.5 per
cent in 2012 and has levelled off since.
Looking at the trade in goods, developing economies’ share in world exports of goods has
plateaued at just above 44 per cent since 2012 (see figure 1). In the developing economies of
Africa, the 2017 upswing in world trade manifested itself in export growth; African exports
increased by 18 per cent compared with the previous year, and by 14 per cent in 2018.
As shown in figure 1, in 2018, developing economies’ share of world services exports (US$5.8
trillion) was 29.7 per cent (US$1.7 trillion), while exports from developed economies were
valued at US$4.0 trillion. Since 2000, growth has been significant when they accounted for 21
per cent (US$0.35 trillion).
The top five services exporters, China, India, Singapore, Hong Kong SAR and the Republic of
Korea, account for half of developing economies’ services exports
7
.
7
Developing countries share in World trade
, https://sdgpulse.unctad.org/developing-economies-in-international-trade/