


 10 / 125

COMCEC Trade Outlook 2019
3
1.
DEVELOPMENTS IN GLOBAL MERCHANDISE TRADE
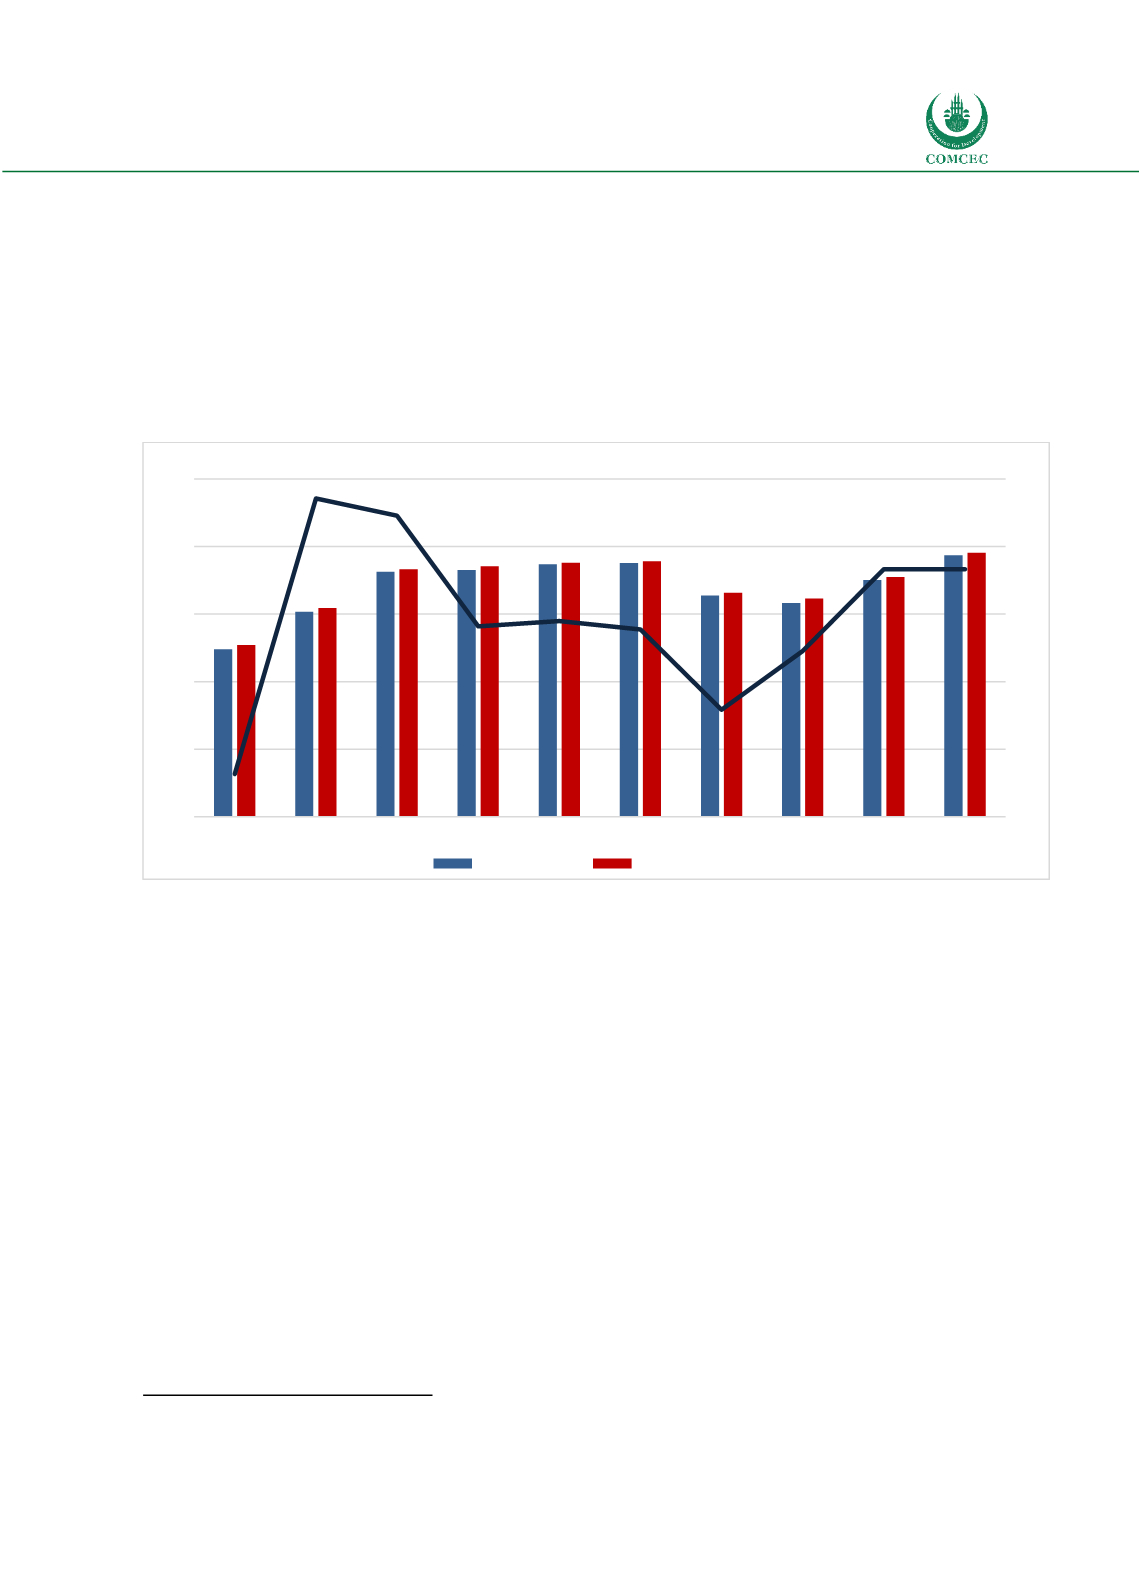
World merchandise trade as measured by the average of world exports and world imports (in
current USD) grew at an annual average rate of 12.2 per cent between 2000 and 2008 period.
After contracting sharply in 2009 due to global crisis, word trade rebounded rapidly in 2011,
but remained weak between 2012 and 2016 period. 2017 marked the first year that the world
trade increased significantly both in value and volume terms since the global crisis. With 10.30
per cent increase and 39.8 trillion USD, the same pace continued in 2018.
Figure 1: Global Trade in the Last Decade
Source: IMF Direction of Trade Statistics
Nominal trade values rose in 2018 due to a combination of volume and price changes. World
merchandise exports totalled to 19.37 trillion USD, an increase of slightly over 10 per cent from
the previous year. The rise was partly due to higher oil prices, which were up roughly 20 per
cent for the whole of 2018. However, oil prices fell 25 per cent between October and December
as negative economic news and economic uncertainty reduced expected demand for energy in
the near future.
1
According to the experts, exchange rates probably had aminimal impact on nominal trade values
in US dollar terms in 2018. Despite fluctuations over the course of the year, the value of the US
dollar was little changed between 2017 and 2018. The nominal effective exchange rate of the US
dollar against a broad basket of currencies was only down 1.0 per cent year-on-year. The euro
registered a 4.3 per cent appreciation in nominal effective terms while the Chinese yuan and the
UK pound rose 1.4 per cent and 1.5 per cent, respectively. The Japanese yen was mostly
unchanged in 2018, with an average appreciation of 0.2 per cent in 2018.
1
WTO World Trade Report,2018
-23.04
21.83
19.04
1.00
1.87
0.51
-12.56
-2.97
10.31 10.30
-30
-25
-20
-15
-10
-5
0
5
10
15
20
25
0
5
10
15
20
25
2009 2010 2011 2012 2013 2014 2015 2016 2017 2018
Trillion USD
Percent
World Export
World Import