


 11 / 125

COMCEC Trade Outlook 2019
4
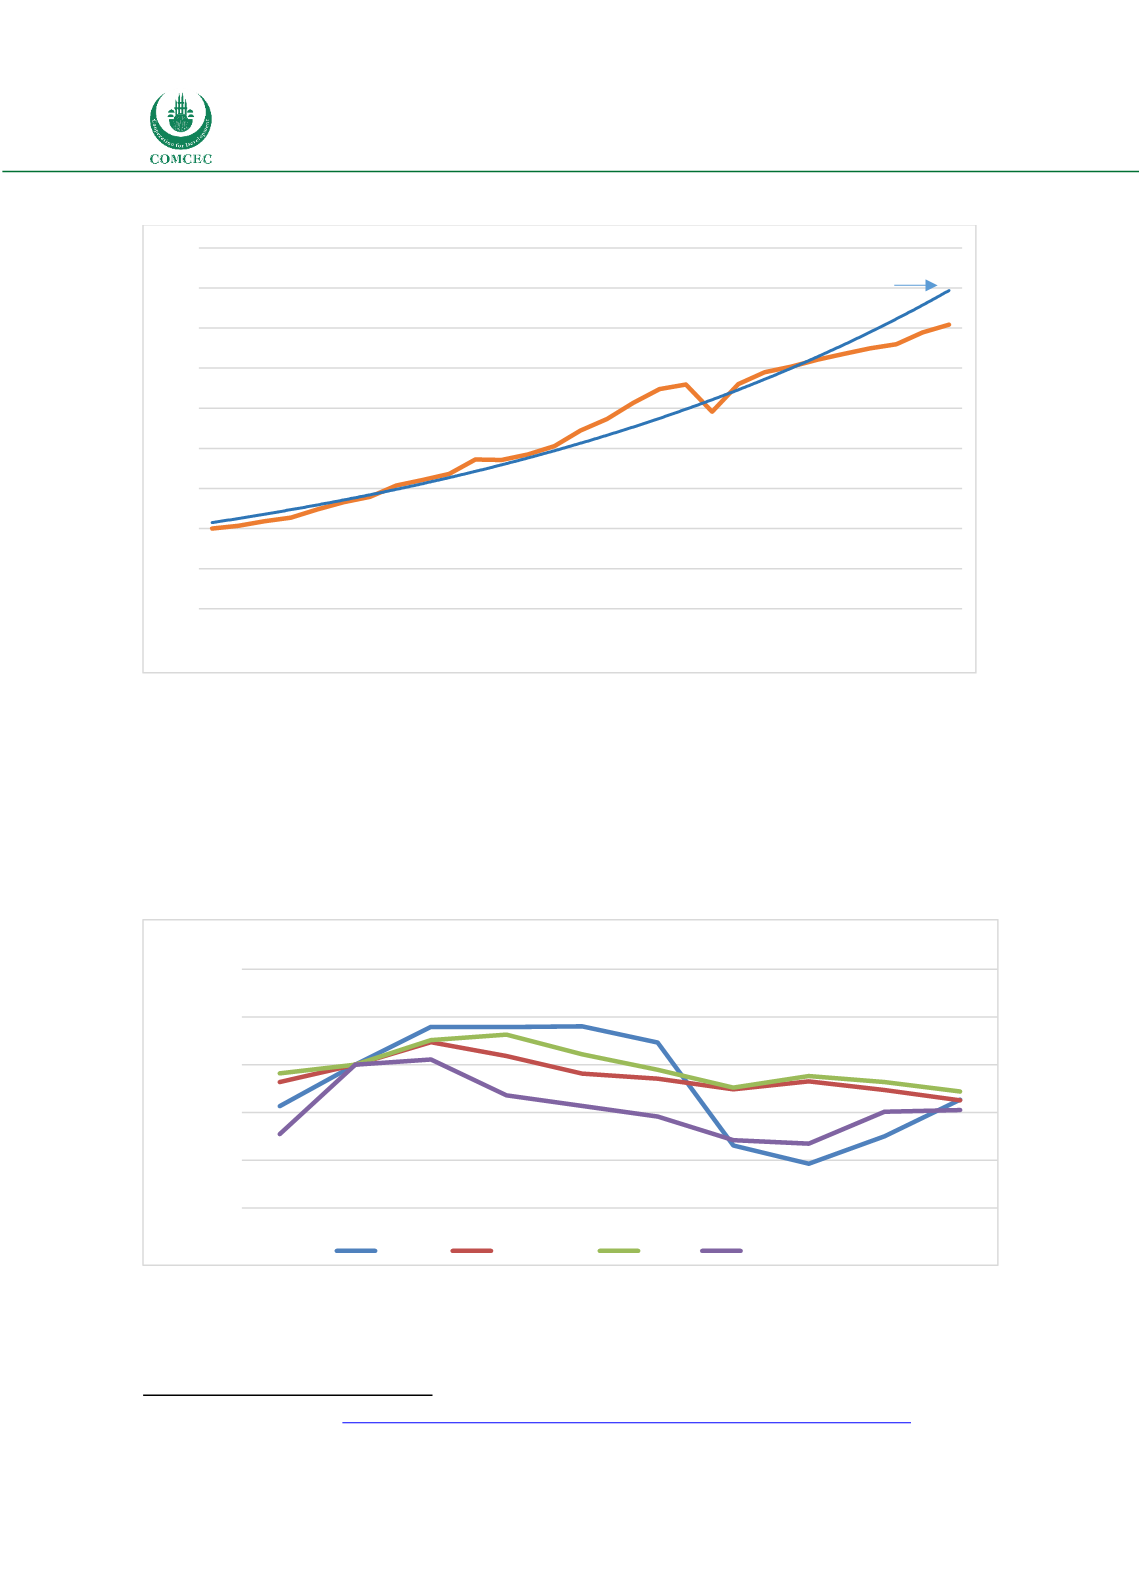
Figure 2: World Export Volume
Source: WTO
On the export side, the slowdown was mostly due to reduced shipments from developed
countries, which contracted year on-year in three out of the four quarters of 2018.
On the import side, developed countries recorded slow growth throughout the year, particularly
in the first half. Meanwhile, developing economies and the Commonwealth of Independent
States (CIS) saw imports fall 2.1 per cent in the final quarter of 2018 despite stronger growth
earlier in the year.
2
Figure 3: Evolution of the Commodity Prices
Source: World Bank Commodity Price Data
2
World Trade Development
, https://www.wto.org/english/res_e/statis_e/wts2019_e/wts2019chapter03_e.pdf0
50
100
150
200
250
300
350
400
450
1990
1991
1992
1993
1994
1995
1996
1997
1998
1999
2000
2001
2002
2003
2004
2005
2006
2007
2008
2009
2010
2011
2012
2013
2014
2015
2016
2017
2018
Trend
40
60
80
100
120
140
2009 2010 2011 2012 2013 2014 2015 2016 2017 2018
Price Indices (2010=100)
Energy
Agriculture
Food
Metals & Minerals