


 21 / 125

COMCEC Trade Outlook 2019
14
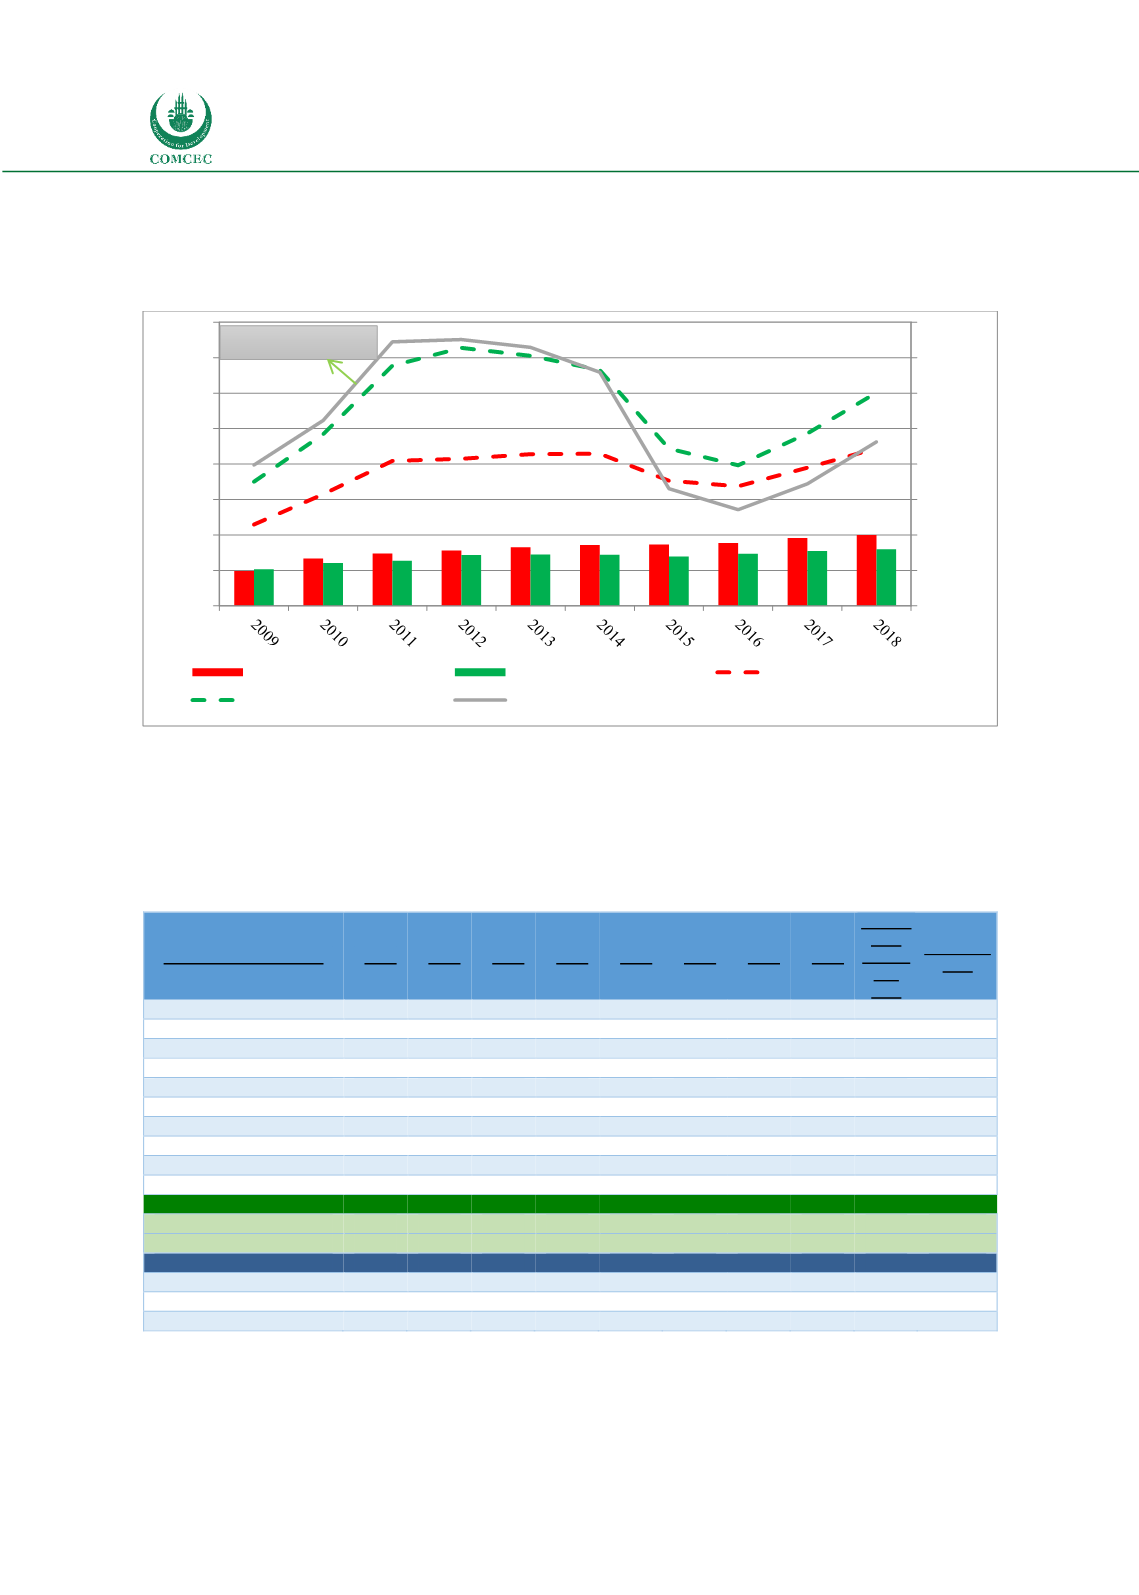
slight increase in OIC export volume indicated that the most of the increase in total OIC exports
was driven by rising export prices in 2018. It should also be noted that oil production curbs in
some oil exporters of OIC limited quantity exported.
Figure 13: Export Value versus Export Volume Indices for the World and the OIC
Source: IMF, UNCTADSTAT
Table 2 illustrates that OPEC countries oil production decreased by 0.4 percent in 2017 and 0.8
per cent in 2018. Saudi Arabia, UAE, Kuwait, Qatar, Algeria were among the major oil exporting
OIC countries that decreased their oil production in 2017 and 2018 compared to the previous
year (2016).
Table 2: Oil Production thousand barrels daily
Thousand barrels daily
2011
2012
2013
2014
2015
2016
2017
2018
Growth
Rate
Annual
(%)
2018
Share (%)
2018
Saudi Arabia
11079 11622 11393 11519 11998 12406 11892
12287
3.3%
13.0%
Iran
4452
3810
3609
3714
3853
4586
5024
4715
-6.1%
5.0%
Iraq
2773
3079
3103
3239
3986
4423
4533
4614
1.8%
4.9%
United Arab Emirates
3303
3440
3577
3603
3898
4038
3910
3942
0.8%
4.2%
Kuwait
2909
3164
3125
3097
3061
3141
3001
3049
1.6%
3.2%
Nigeria
2461
2412
2279
2276
2201
1900
1991
2051
3.0%
2.2%
Kazakhstan
1684
1664
1737
1710
1695
1655
1838
1927
4.8%
2.0%
Qatar
1824
1928
1991
1975
1933
1938
1874
1879
0.3%
2.0%
Algeria
1642
1537
1485
1589
1558
1577
1540
1510
-2.0%
1.6%
Libya
516
1539
1048
518
437
412
929
1010
8.7%
1.1%
Total World
84009 86228 86647 88736 91547 91822 92502 94718
2.4%
100.0%
OPEC
36724 38292 37293 37228 38601 39736 39673
39338
-0.8%
41.5%
Non-OPEC
47285 47936 49354 51508 52946 52086 52828
55380
4.8%
58.5%
memo item:
US
7870
8910 10073 11773 12773 12340 13135
15311
16.6%
16.2%
Russian Federation
10533 10656 10807 10860 11
007 11269 11255
11438
1.6%
12.1%
Canada
3515
3740
4000
4271
4388
4451
4798
5208
8.5%
5.5%
Source: Source: Reproduced from BP Statistical Review of World Energy 2019
Note: Includes crude oil, shale oil, oil sands and natural gas liquids.
20
70
120
170
220
270
320
370
420
80
130
180
230
280
330
380
430
480
2000:100 Oil Price Index
2000: 100 Index
World Export Volume Index
OIC Export Volume Index
World Export Value Index
OIC Export Value Index
Oil Price Index
Brent Oil Price Index