


 16 / 125

COMCEC Trade Outlook 2019
9
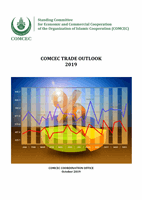
Figure 6: Evolution of the Share of Developing Countries in World Exports
Source: ITC Trade Map
Fourth pattern in global trade is the maturation of global value chains (GVCs). Increasing
participation to the GVCs in particular of the developing countries was a key factor driving the
dramatic increase in developing countries’ trade and in turn the world trade in the period prior
to the global crisis. However, a recent trend has been the slowing pace of global value chains,
which has negative impacts on world trade growth. The shift to domestic production of
intermediate inputs by China, Japan and US firms contributed to the slowdown in GVCs.
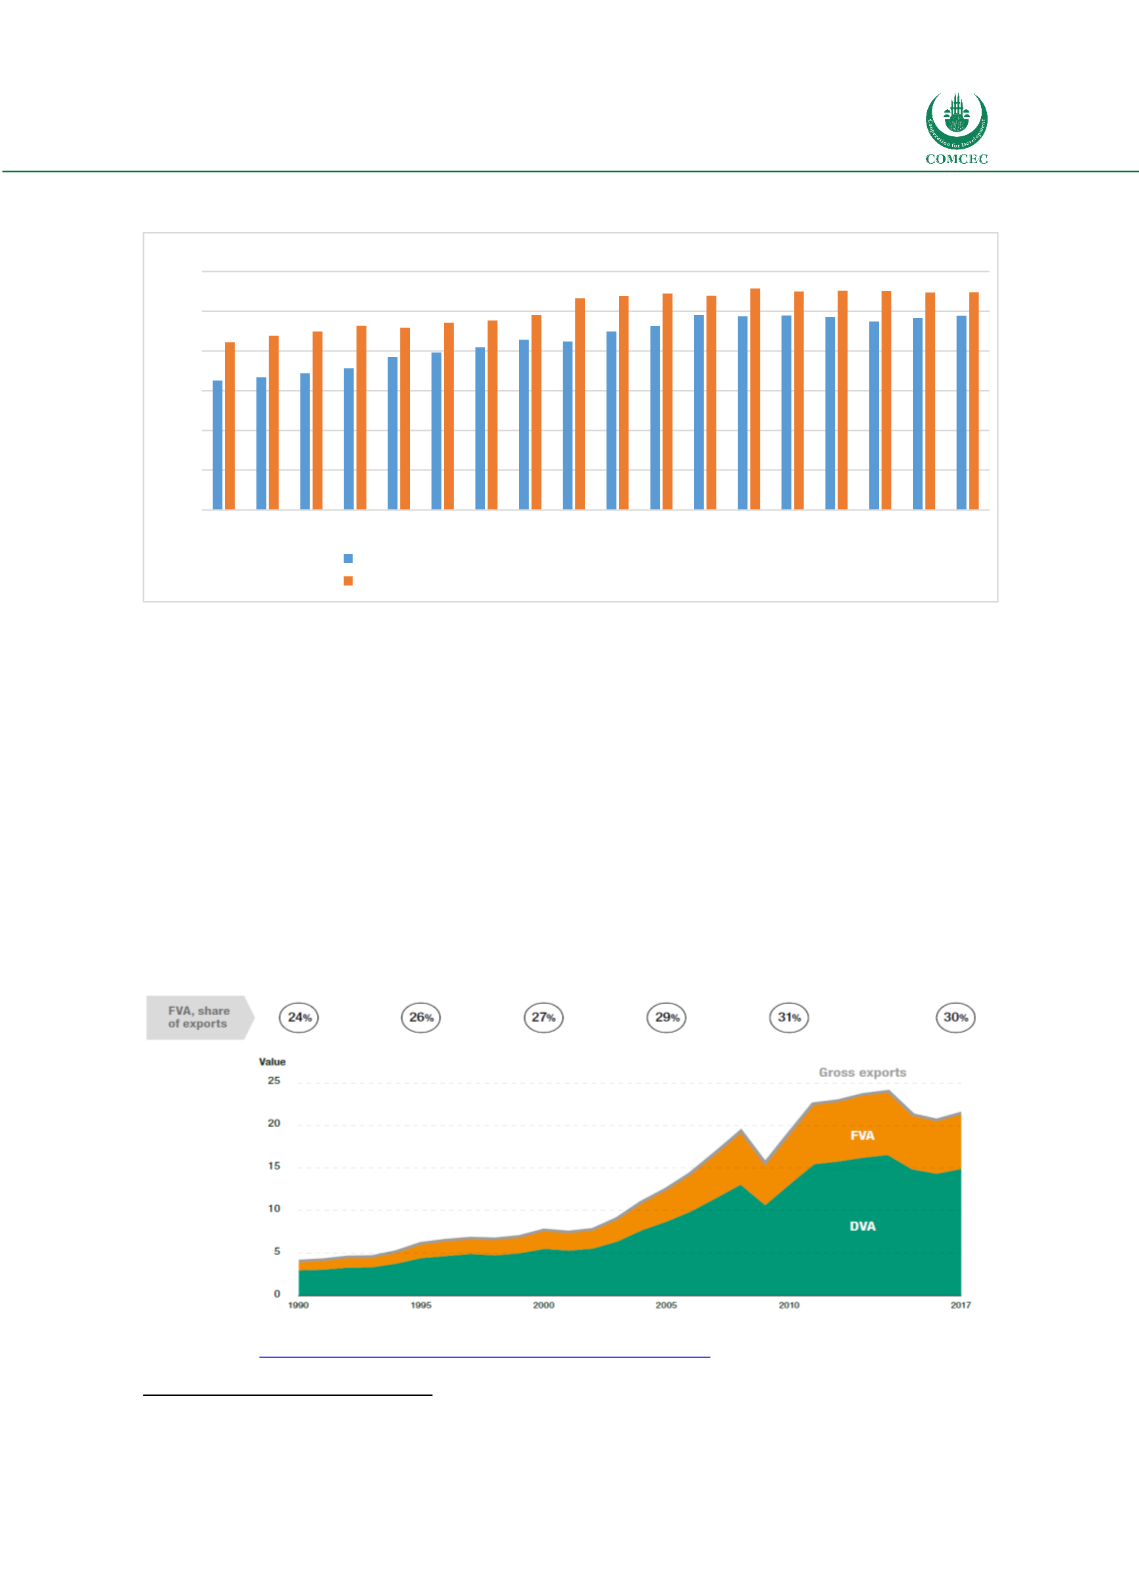
Figure 7 below illustrates evolution of foreign value added in production (FVA) and domestic
value added in production (DVA) as a percentage of exports. FVA which is considered as a key
measure of GVCs increased steadily until 2010. However growth of FVA declined in 2015-2016
period and remained weak in 2017 where the share of FVA in total exports declined to 30 per
cent. This represents a reversal in increasing trend of FVA.
8
Figure 7: Evolution of Value Added in Global Trade, 1990-2017 (trillions of USD and per
cent)
Source: Reprinted from “World Investment Report, 2018, Investment and New Industrial Policies” UNCTAD.
Retrieved from
https://unctad.org/en/PublicationsLibrary/wir2018_en.pdf.
8
UNCTAD, World Investment Report 2018
0
10
20
30
40
50
60
2001 2002 2003 2004 2005 2006 2007 2008 2009 2010 2011 2012 2013 2014 2015 2016 2017 2018
per cent
Developing Countries' exports as % of World Exports
South-South Exports as % of Total Developing Countries' Exports