


 23 / 133

COMCEC Trade Outlook 2018
15
The resilience of a country against external economic shocks varies depending on among others
the degree of export diversification. One common measure of concentration is Herfindahl-
Hirschmann Index (HHI)
12
which can take values between 0 and 1 where being close to 0
indicates well diversified exports while a higher value indicates greater concentration of exports
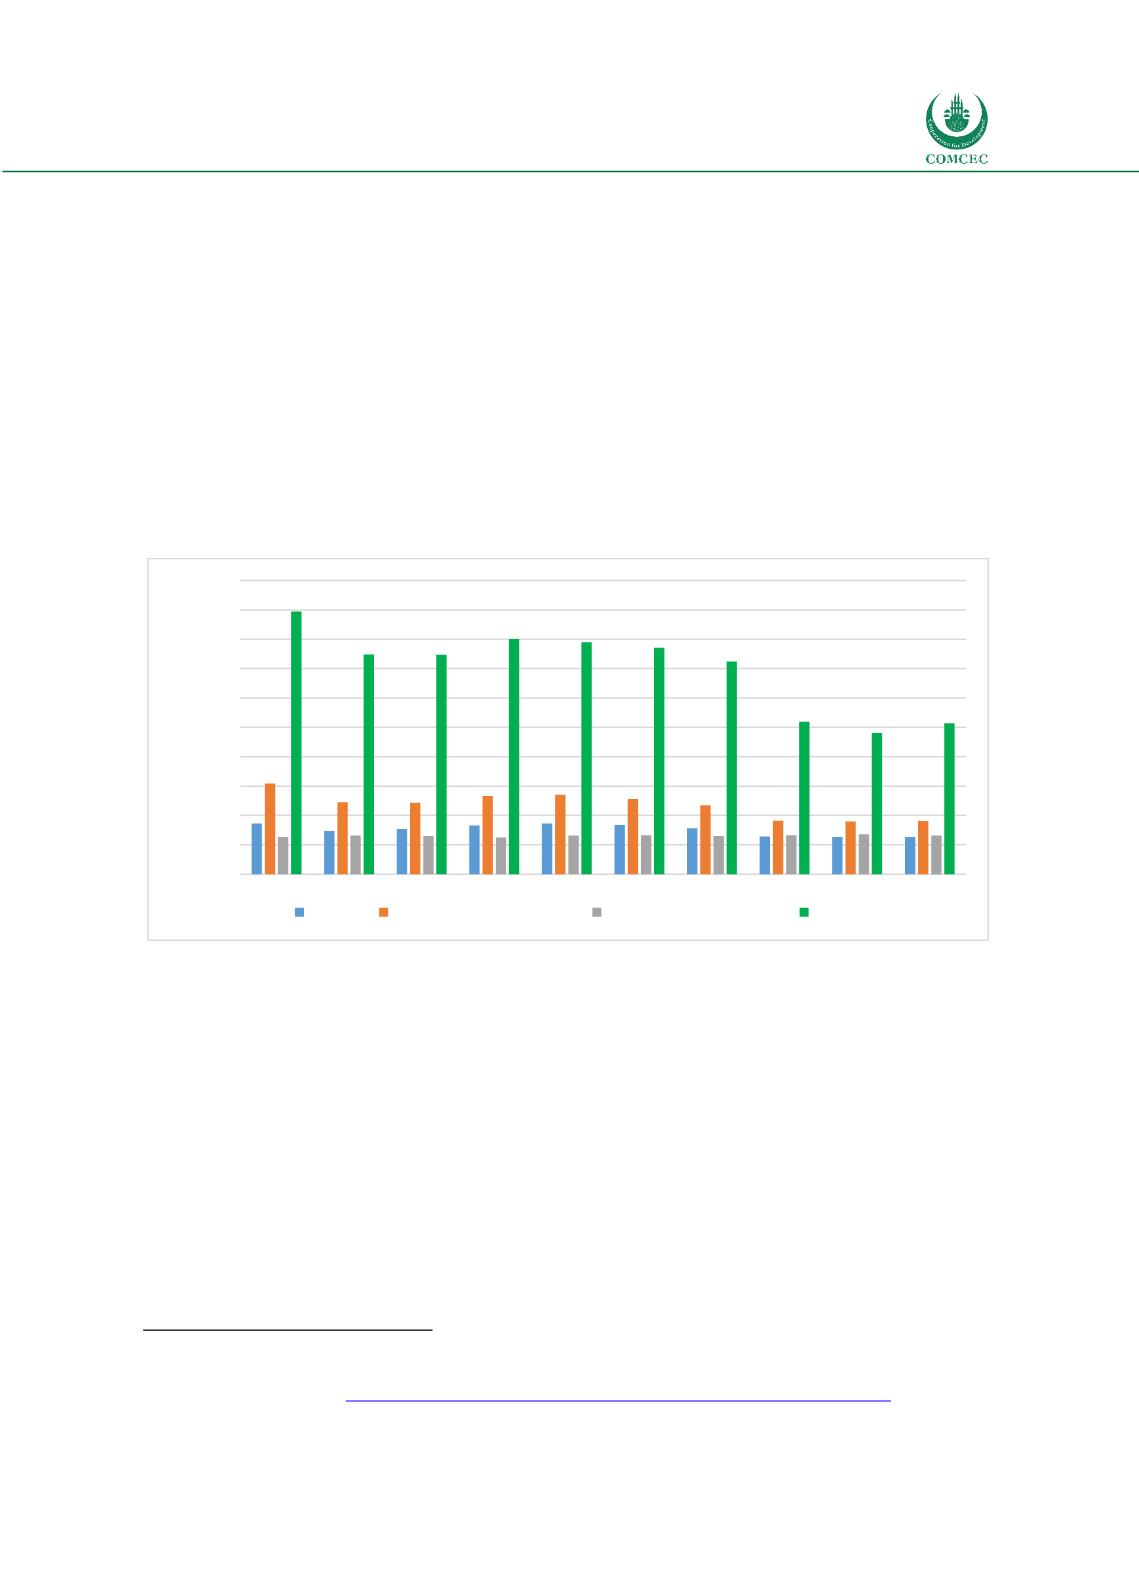
on a few commodities. Figure 16 illustrates the evolution of product diversification in the OIC
compared to world and developed and developing countries for the period 2007-2016
measured by HHI. Developed countries export product diversification has not changed much as
these countries have more stable and mature export structures
13
. This measure shows a modest
tendency towards increasing product diversification in the OIC countries whereas developing
countries achieved a more diversified exports structure in the same period. Moreover, the
product concentration in the OIC countries exports are well above than those of world and
developing countries. OIC has a HHI of 0.26 whereas world and developing countries have HHI
of 0.06 and 0.09 respectively in 2017.
Figure 16: Evolution of Herfindahl-Hirschmann Index (Product HHI)
Source: UNCTAD STAT
Figure 17 illustrates product diversification of OIC countries’ exports in 2017 measured by
Herfindahl index. All OIC countries has a more concentrated export product structure compared
to world averages. According to the Herfindahl index Turkey has the most diversified export
product structure amongst the OIC countries with a HHI of 0.08 followed by other manufactures
exporters of OIC as Tunisia, Indonesia, Lebanon and Egypt. On the other hand some major oil
exporters have a very concentrated export product structure such as Iraq (HHI: 0.94),
Azerbaijan (HHI:0.81), Kuwait (HHI: 0.63) and Saudi Arabia HHI:(0.59).
12
The Herfindahl-Hirschmann Index (HHI) is calculated by taking the square of export shares of all export categories in the
market: This index gives greater weight to the larger export categories and reaches a value of unity when the country
exports only one commodity
. http://unctadstat.unctad.org/wds/TableViewer/tableView.aspx?ReportId=12013
WTO World Tariff Profiles, 2017
0.0
0.1
0.1
0.2
0.2
0.3
0.3
0.4
0.4
0.5
0.5
HHI Product Index
World Developing economies
Developed economies
OIC