


 24 / 133

16
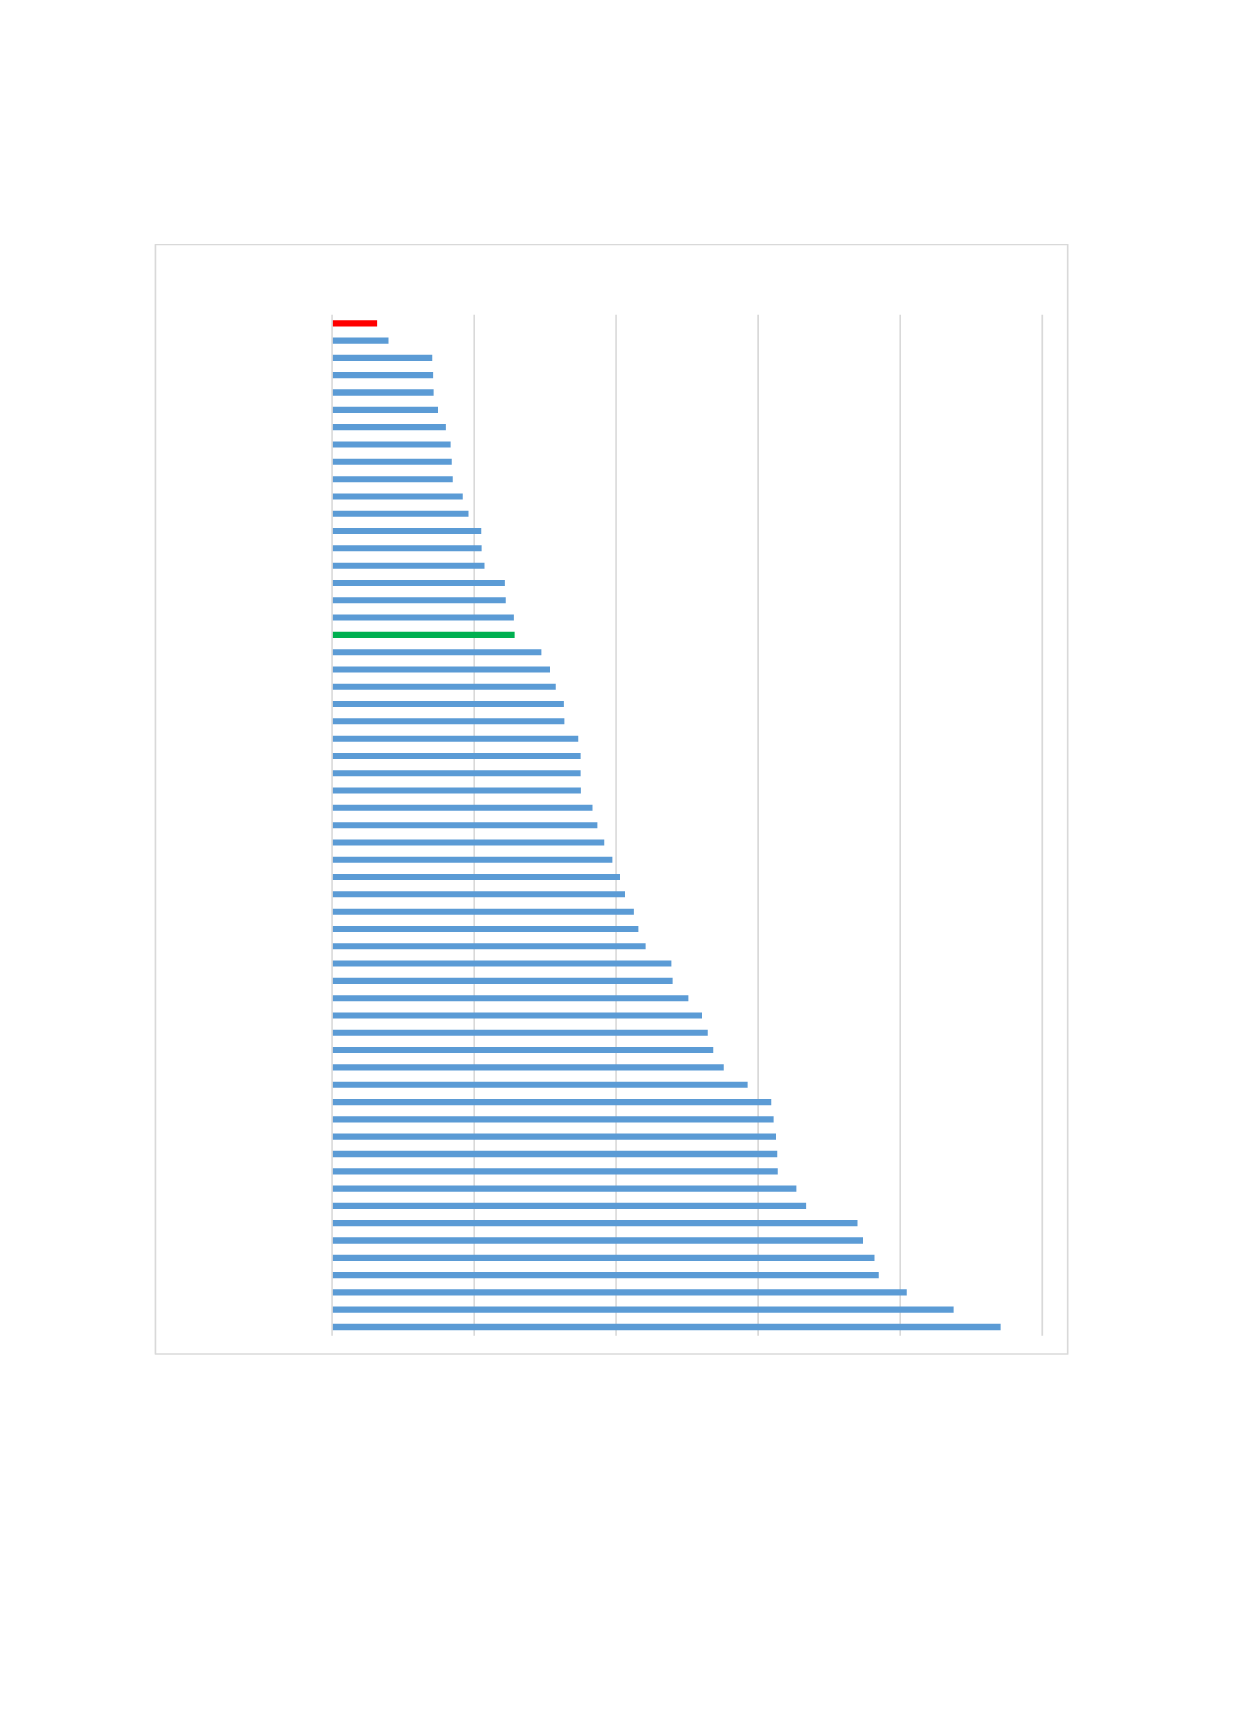
Figure 17: Herfindahl-Hirshmann Index (Product HHI) by OIC Countries (2017)
Source: UNCTADSTAT database
The commodity concentration could also be observed when countries looked into specifically.
Due to their undiversified economic structure many OIC countries rely upon a few primary
products for their exports or depend heavily on natural resources which might result in a severe
export revenue loss in case of either foreign demand and/or commodity price shocks or drought
for agricultural commodity exporters. Recent oil price collapse underlies the importance of
0.06
0.08
0.14
0.14
0.14
0.15
0.16
0.17
0.17
0.17
0.18
0.19
0.21
0.21
0.21
0.24
0.24
0.26
0.26
0.29
0.31
0.32
0.33
0.33
0.35
0.35
0.35
0.35
0.37
0.37
0.38
0.39
0.41
0.41
0.42
0.43
0.44
0.48
0.48
0.50
0.52
0.53
0.54
0.55
0.59
0.62
0.62
0.63
0.63
0.63
0.65
0.67
0.74
0.75
0.76
0.77
0.81
0.88
0.94
0.0
0.2
0.4
0.6
0.8
1.0
World
Turkey
Tunisia
Indonesia
Lebanon
Egypt
Djibouti
Morocco
Jordan
Syria
Palestine
Malaysia
Uganda
Pakistan
Senegal
Togo
UAE
Albania
OIC
Mozambique
Tajikistan
Benin
Bahrain
Sierra Leone
Cameroon
Afghanistan
Niger
Côte d'Ivoire
Mauritania
Yemen
Kyrgyzstan
Oman
Bangladesh
Gambia
Uzbekistan
Guyana
Guinea
Sudan
Algeria
Qatar
Turkmenistan
Kazakhstan
Iran
Somalia
Saudi Arabia
Mali
Burkina Faso
Kuwait
Comoros
Brunei Darussalam
Gabon
Maldives
Libya
Suriname
Nigeria
Chad
Azerbaijan
Guinea-Bissau
Iraq
HHI Product Index