


 28 / 133

20
imports made from this country in 2017. Top ten countries accounted for nearly half of total
extra-OIC imports in this year (Table 5).
Table 5: Major Countries of Origin of Total Extra-OIC Imports
Countries
(Billion Dollars)
Share %
2015
2016
2017
2015
2016
2017
China
243.2
235.0
276.1
15.4
15.9
16.5
United States
114.8
107.3
113.9
7.3
7.3
6.8
Germany
87.5
81.5
80.6
5.5
5.5
4.8
India
65.2
68.5
75.1
4.1
4.6
4.5
Japan
63.8
61.9
71.6
4.0
4.2
4.3
Russian Federation
70.3
65.4
67.9
4.4
4.4
4.1
Korea, Republic of
58.5
47.8
59.2
3.7
3.2
3.5
France
58.4
50.4
56.9
3.7
3.4
3.4
Italy
52.1
48.7
52.9
3.3
3.3
3.2
Singapore
51.6
48.5
52.1
3.3
3.3
3.1
Total of Top Ten Countries
865.3
814.8
906.3
54.7
55.3
54.0
Total OIC Export
1,582.4
1,473.7
1,677.3
100.0
100.0
100.0
Source: IMF Direction of Trade Statistics
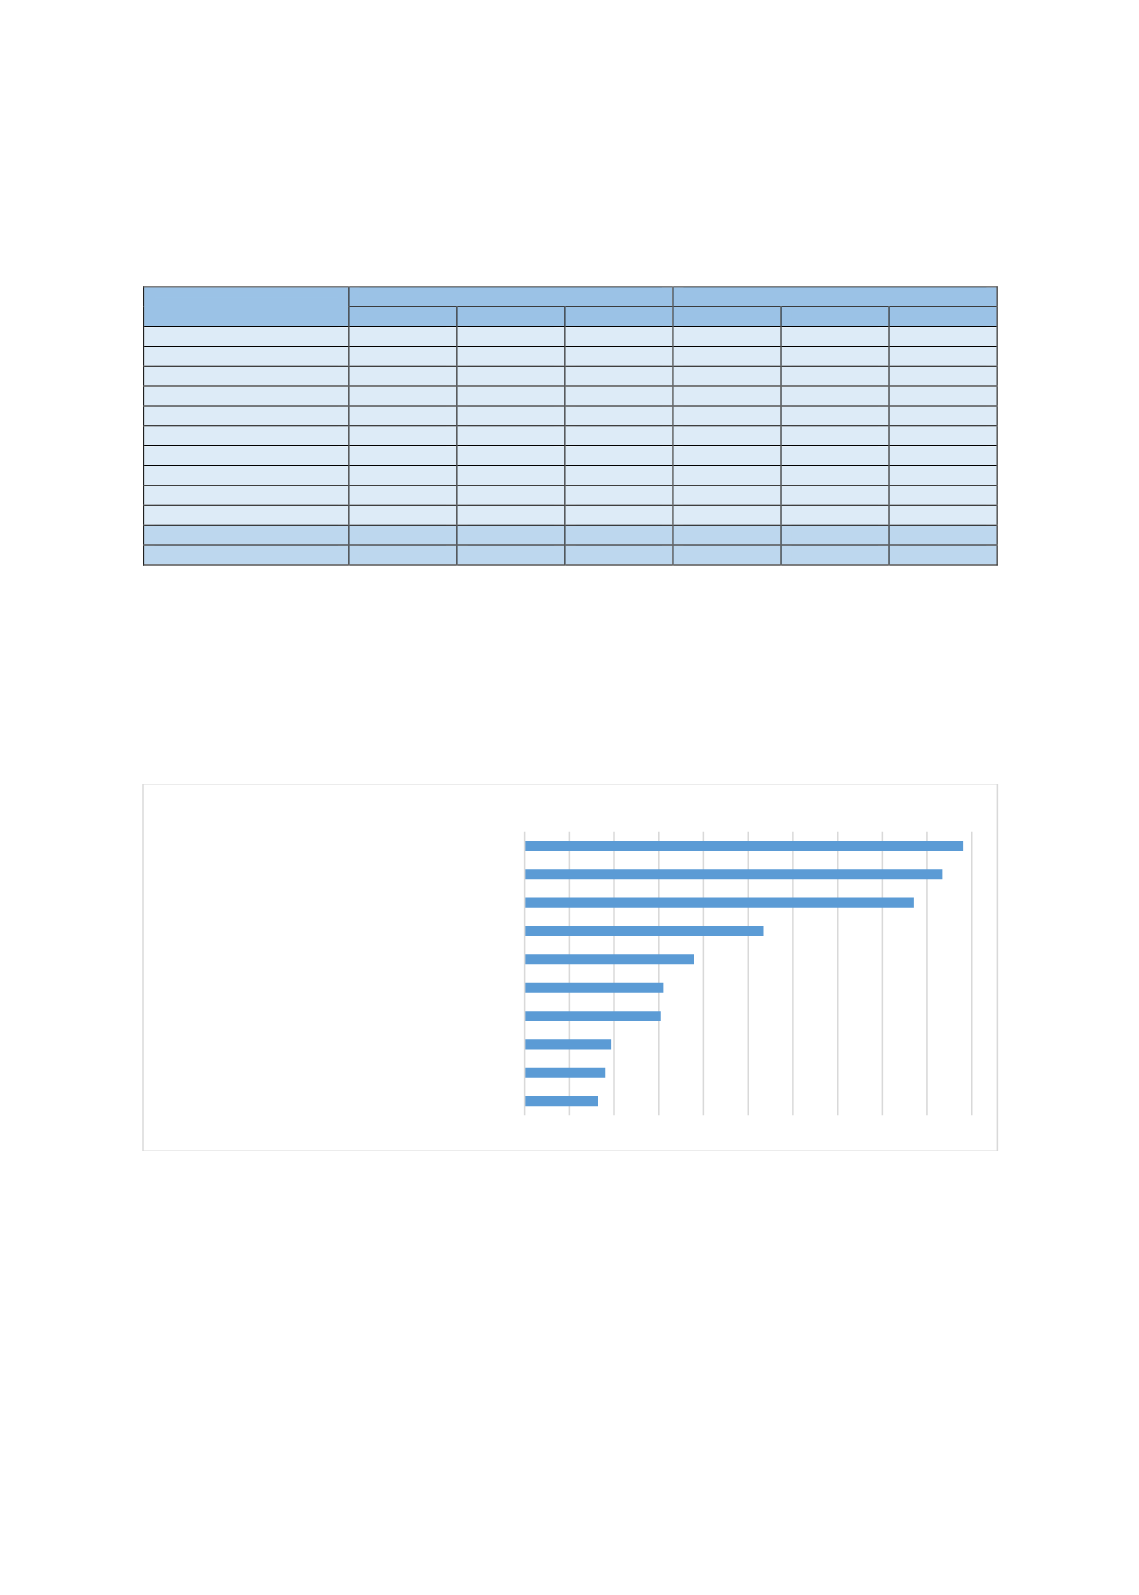
Total OIC imports was more diversified than the total
OIC exports in that manufactured items such as
machinery, electrical and electronic equipment, vehicles
other than railway, tramway, and natural or cultured
pearls and precious stones-metals also constituted an
important part of total imports.
Figure 23: OIC Imports fromWorld - Top 10 Items in 2017
Source: ITC Trade map
0 20 40 60 80 100 120 140 160 180 200
Pharmaceutical products
Cereals
Articles of iron or steel
Iron and steel
Plastics and articles thereof
Natural or cultured pearls, precious or semi-…
Vehicles other than railway or tramway rolling…
Mineral fuels, mineral oils and products etc.
Electrical machinery and equipment and parts…
Machinery, mechanical appliances etc.
Billion USD
“The total OIC imports
is more diversified than
the total OIC exports”